Fig. 3
Download original image
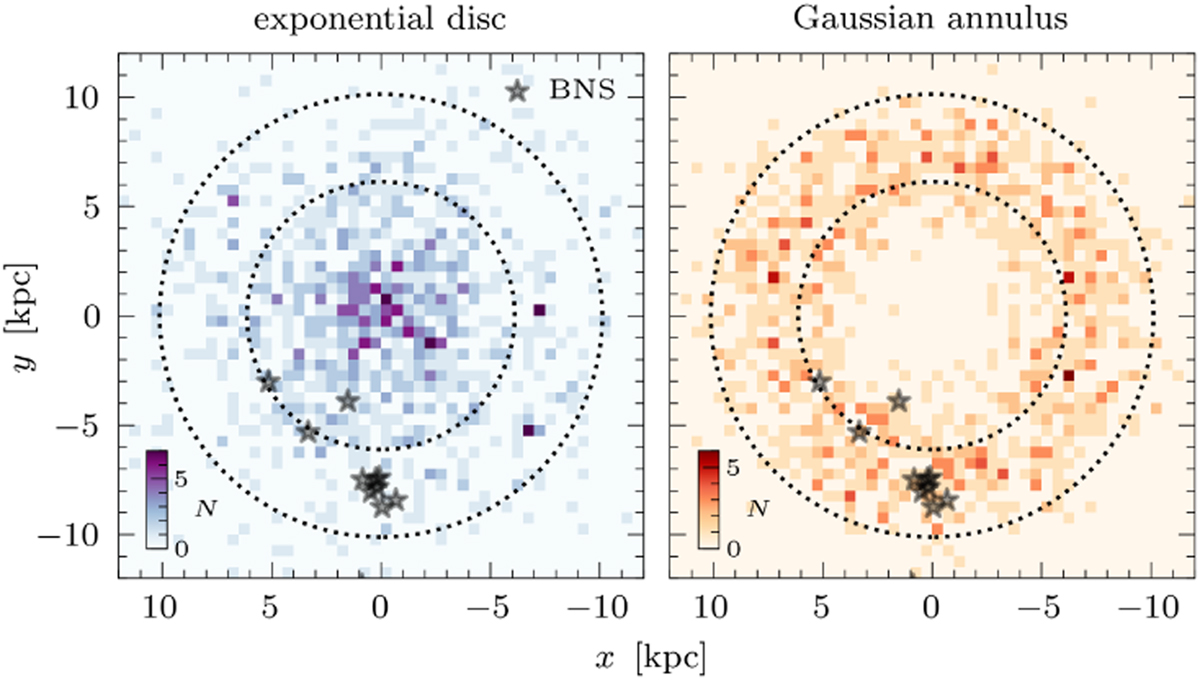
Priors for the initial positions in our simulation, shown by seeding 103 points and displaying their density in normalised 2D histograms with bins of 0.5 kpc. The left panel shows the exponential disc prior from Disberg et al. (2024), and the right panel shows the Gaussian annulus prior as defined in Eq. (5). The black stars show the positions of the Galactic BNSs, determined as the mean of the Monte Carlo distributions described in Sect. 2.2 (cf. Gaspari et al. 2024). The dotted lines show R = R⊙ ± 2 kpc, which traces the edges of the solar neighbourhood (as defined by Disberg et al. 2024).
Current usage metrics show cumulative count of Article Views (full-text article views including HTML views, PDF and ePub downloads, according to the available data) and Abstracts Views on Vision4Press platform.
Data correspond to usage on the plateform after 2015. The current usage metrics is available 48-96 hours after online publication and is updated daily on week days.
Initial download of the metrics may take a while.