Fig. D.1
Download original image
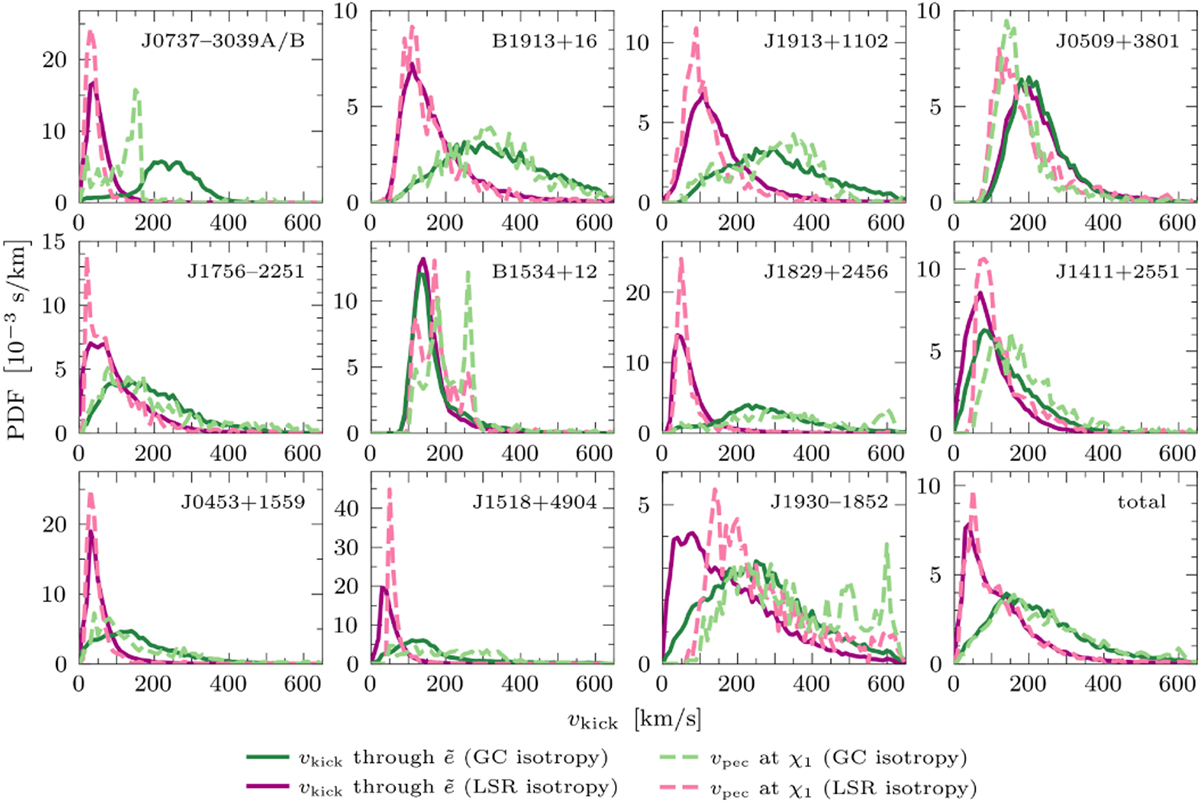
Comparison between our kick estimates as constrained through ẽ (solid lines) and peculiar velocities (vpec) at the first disc crossing (dashed lines) for GC isotropy (green lines) and LSR isotropy (purple lines). For both isotropies, we show the average between the results using the exponential disc prior and the ones using the Gaussian annulus prior (as shown in Fig. 11). The lines trace normalised histograms with bins of 10 km/s.
Current usage metrics show cumulative count of Article Views (full-text article views including HTML views, PDF and ePub downloads, according to the available data) and Abstracts Views on Vision4Press platform.
Data correspond to usage on the plateform after 2015. The current usage metrics is available 48-96 hours after online publication and is updated daily on week days.
Initial download of the metrics may take a while.