Fig. C.1
Download original image
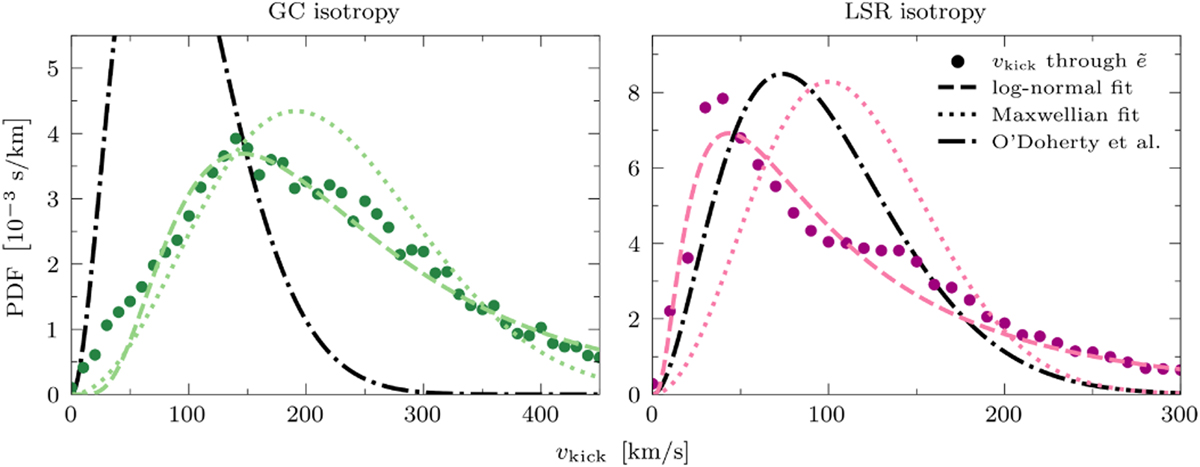
Total kick distribution as determined through ẽ (dots) together with the fitted log-normal (dashed lines) and Maxwellian (dotted lines) distributions for GC isotropy (left panel) and LSR isotropy (right panel). The dots show the average of the results using the exponential disc prior and the ones using the Gaussian annulus prior, tracing the tops of normalised histograms with bins of 10 km/s. The fitted parameters of the distributions are given in Table C.1. We also show the kick distribution that O’Doherty et al. (2023) find for neutron stars with low-mass companions (black dash-dotted lines).
Current usage metrics show cumulative count of Article Views (full-text article views including HTML views, PDF and ePub downloads, according to the available data) and Abstracts Views on Vision4Press platform.
Data correspond to usage on the plateform after 2015. The current usage metrics is available 48-96 hours after online publication and is updated daily on week days.
Initial download of the metrics may take a while.