Fig. B.1
Download original image
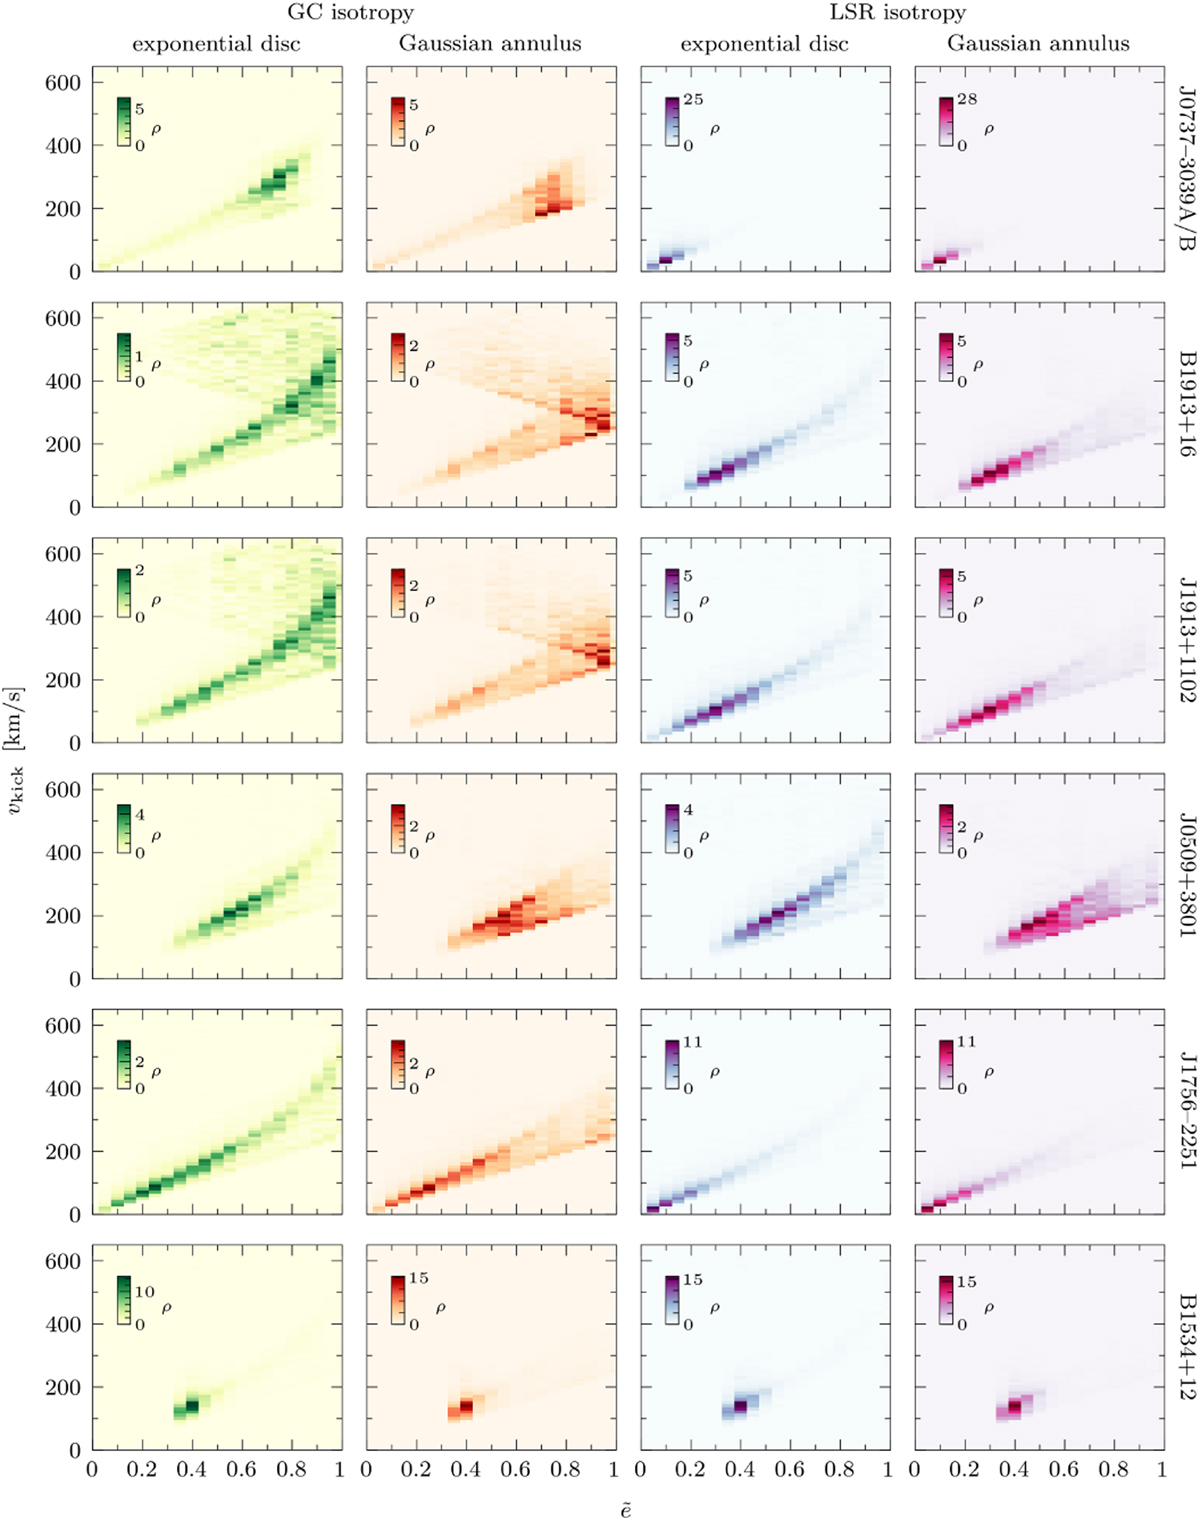
Posterior distributions of vkick versus ẽ for the first six BNSs (rows), following either the GC-isotropic (two left columns) or LSR-isotropic (two right columns) estimations of ẽ, as shown in Fig. 9. For each isotropy assumption, we computed the posterior using the results from the exponential disc (left column) or Gaussian annulus (right column) prior, as shown in Fig. 10. The posteriors are shown in 2D histograms with ẽ bins of 0.05 and vkick bins of 10 km/s, and are normalised so that the (linear) colour scale shows the probability density (ρ) in units of 10−2 s/km.
Current usage metrics show cumulative count of Article Views (full-text article views including HTML views, PDF and ePub downloads, according to the available data) and Abstracts Views on Vision4Press platform.
Data correspond to usage on the plateform after 2015. The current usage metrics is available 48-96 hours after online publication and is updated daily on week days.
Initial download of the metrics may take a while.