Fig. A.1
Download original image
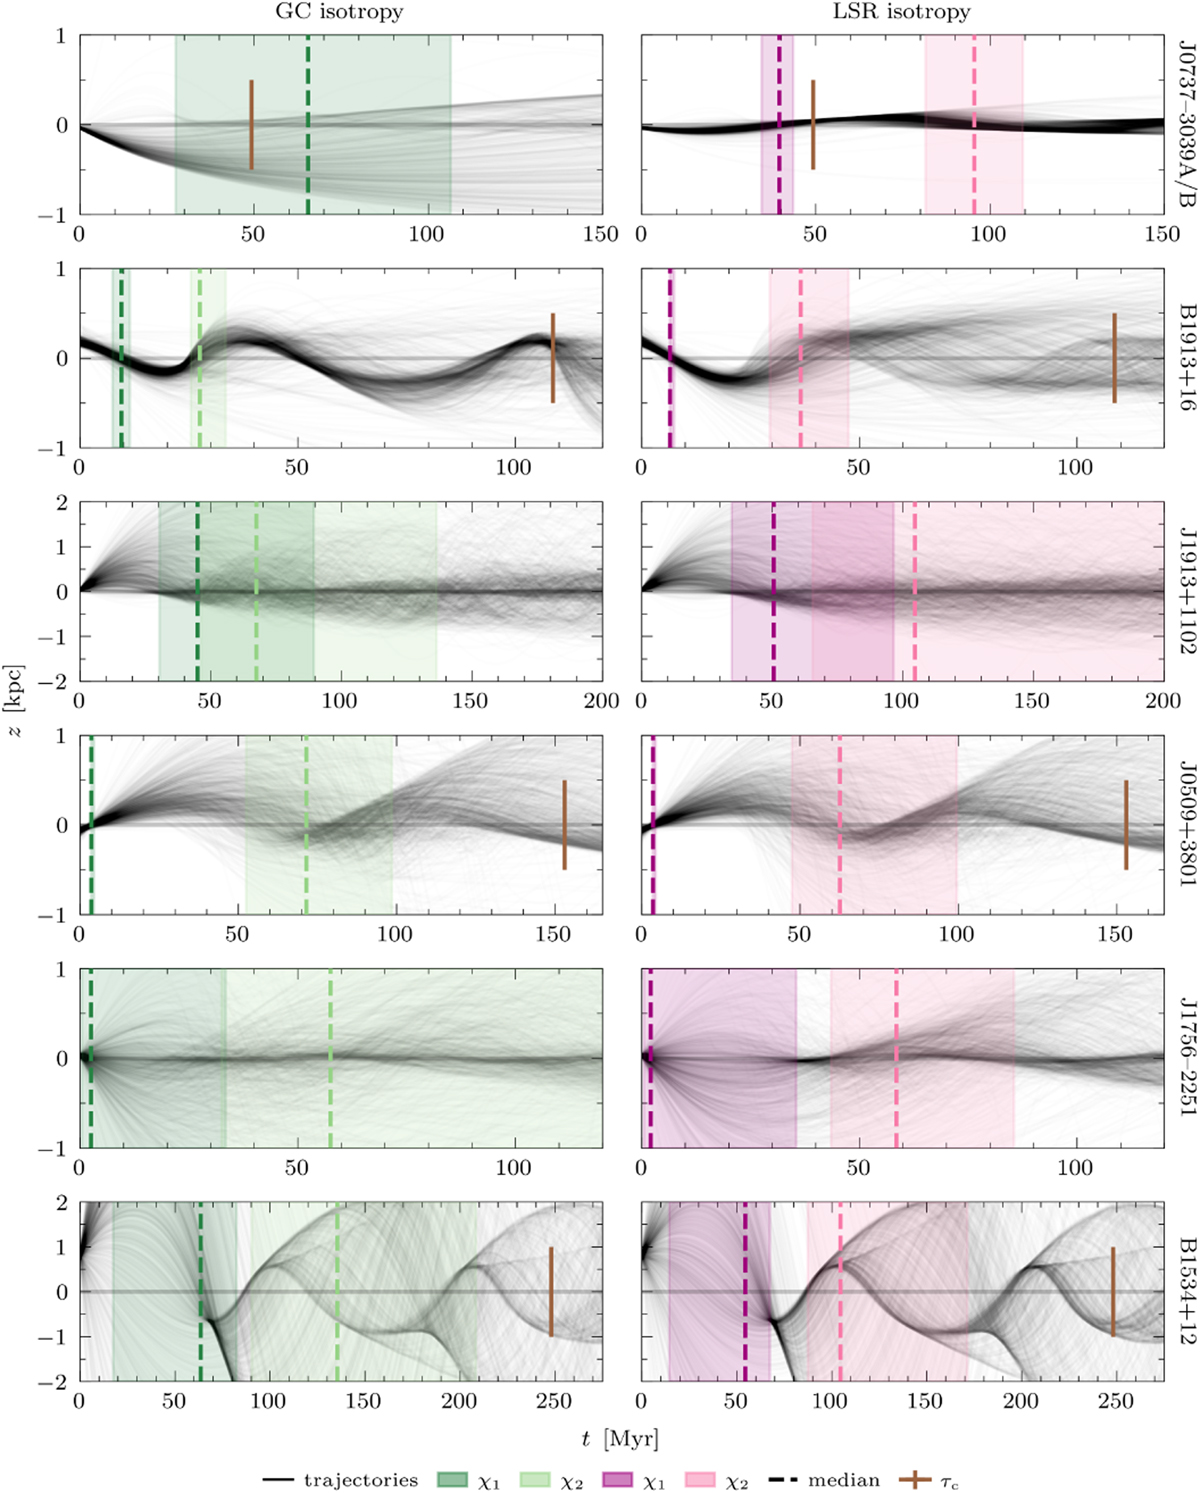
Disc crossings of the first six Galactic BNSs, estimated using the method described in Sect. 2.2, for GC isotropy (left column, through Eq. 3) and LSR isotropy (right column, through Eq. 4). The black lines show the overplotted trajectories of the BNSs, where the dark green and dark purple regions correspond to the 68% intervals of χ1, and the light green and light purple regions correspond to the 68% intervals for χ2 (as given in Table 2). The dashed lines of the same colour indicate the medians in these regions. The brown plusses show τc , where the horizontal line extends to the 68% interval (which does not tend to be visible) and the vertical line is located at the median (which are also given in Table 2).
Current usage metrics show cumulative count of Article Views (full-text article views including HTML views, PDF and ePub downloads, according to the available data) and Abstracts Views on Vision4Press platform.
Data correspond to usage on the plateform after 2015. The current usage metrics is available 48-96 hours after online publication and is updated daily on week days.
Initial download of the metrics may take a while.