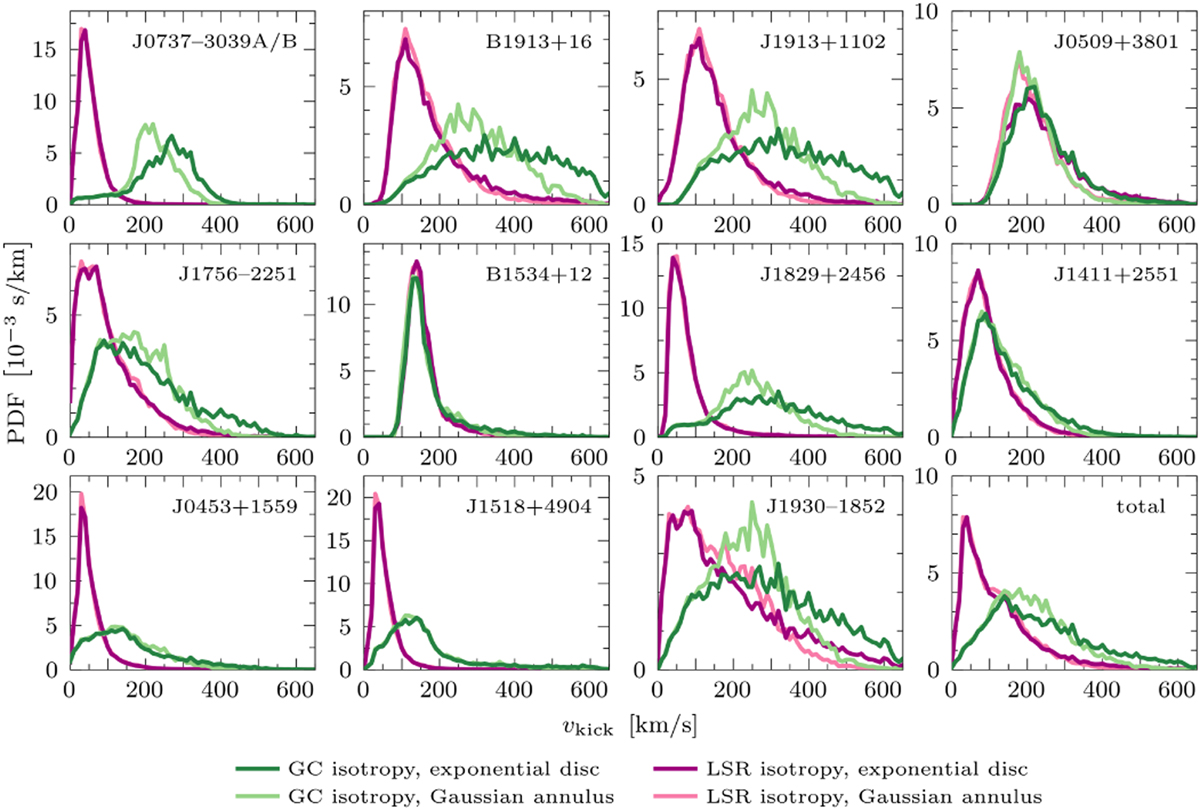
Fig. 11
Download original image
Posterior kick distributions resulting from our eccentricity-constrained estimates for GC isotropy (green lines) and LSR isotropy (purple lines) and for the exponential disc (dark lines) and Gaussian annulus (light lines) prior. The panels show the normalised results from integrating the posteriors in Appendix B over ẽ, meaning the lines trace the values of a histogram with bins of 10 km/s. Each panel shows the distributions for an individual BNS except the lower-right panel, which combines all distributions.
Current usage metrics show cumulative count of Article Views (full-text article views including HTML views, PDF and ePub downloads, according to the available data) and Abstracts Views on Vision4Press platform.
Data correspond to usage on the plateform after 2015. The current usage metrics is available 48-96 hours after online publication and is updated daily on week days.
Initial download of the metrics may take a while.