Fig. 10
Download original image
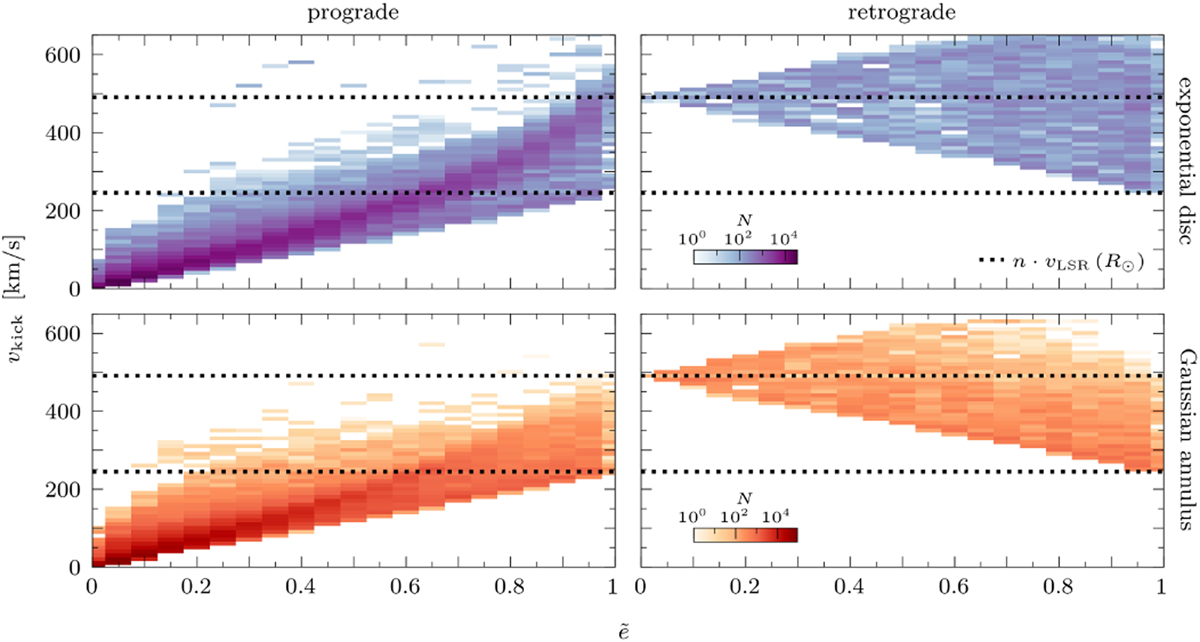
Number of eccentricities found in the solar neighbourhood for each vkick, shown in a 2D histogram with ẽ bins of 0.05 and bins of 10 km/s on a logarithmic colour scale. For each vkick = n ⋅ 10 km/s, we simulate 103 objects using either the exponential disc (top row) or Gaussian annulus (bottom row) prior, and evaluate their orbits in between 40 Myr and tmax = 200 Myr. The resulting eccentricities are divided into prograde (left column) and retrograde (right column) orbits. The dashed lines show 1 and 2 times the circular velocity (vLSR) at a solar radius.
Current usage metrics show cumulative count of Article Views (full-text article views including HTML views, PDF and ePub downloads, according to the available data) and Abstracts Views on Vision4Press platform.
Data correspond to usage on the plateform after 2015. The current usage metrics is available 48-96 hours after online publication and is updated daily on week days.
Initial download of the metrics may take a while.