Fig. 5

Download original image
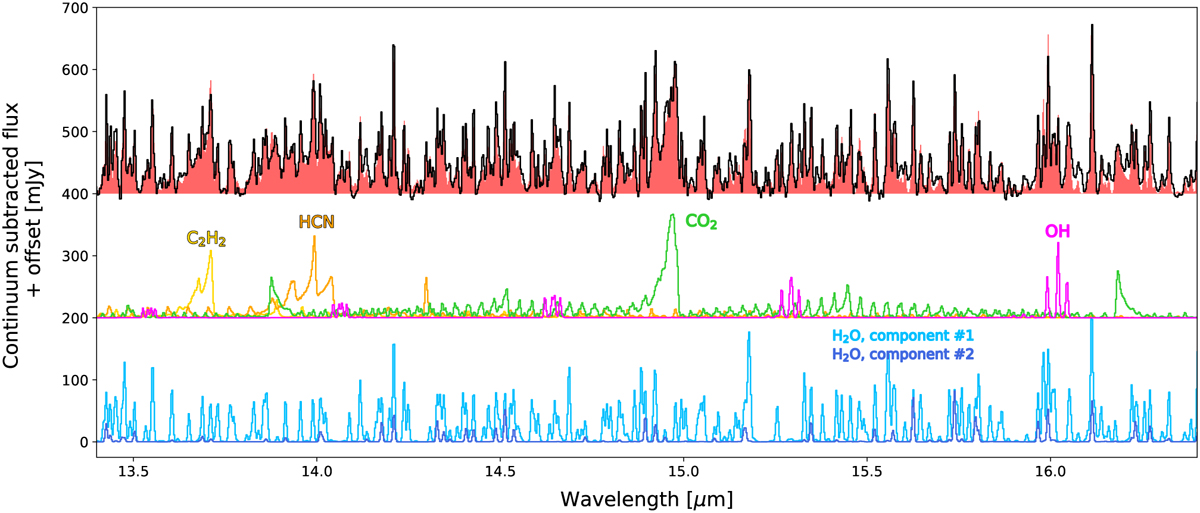
Continuum-subtracted MIRI spectrum (black) compared to the total model (red). Emission from C2H2 (yellow), HCN (orange), CO2 (green), and OH (pink) is present. The two H2O models are shown in light and medium blue. While this wavelength region is fit out to 18 μm, we only show the spectrum out to 16.4 μm for a better visualization of the main molecular species.
Current usage metrics show cumulative count of Article Views (full-text article views including HTML views, PDF and ePub downloads, according to the available data) and Abstracts Views on Vision4Press platform.
Data correspond to usage on the plateform after 2015. The current usage metrics is available 48-96 hours after online publication and is updated daily on week days.
Initial download of the metrics may take a while.


