Fig. 2
Download original image
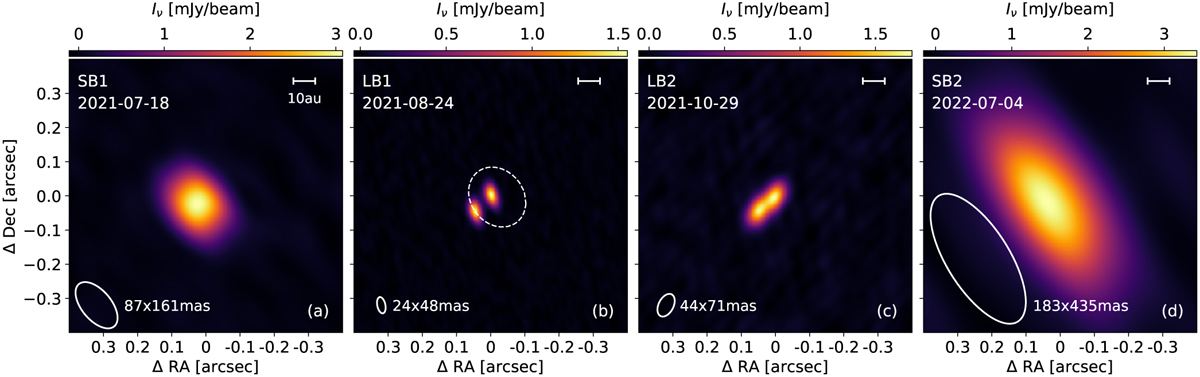
ALMA dust continuum emission at each epoch, sorted by observation date. SB and LB correspond to the short-baseline and long-baseline observations, respectively. The angular resolution is represented by the white ellipse at the bottom-left corner of each panel. The scale bar is 10 au at the distance of the source. The orbit of the system from Allen et al. (2017) is shown as a dotted line in panel b for reference. DF Tau A is at the center of the image, while DF Tau B is to the lower left.
Current usage metrics show cumulative count of Article Views (full-text article views including HTML views, PDF and ePub downloads, according to the available data) and Abstracts Views on Vision4Press platform.
Data correspond to usage on the plateform after 2015. The current usage metrics is available 48-96 hours after online publication and is updated daily on week days.
Initial download of the metrics may take a while.