Fig. 4
Download original image
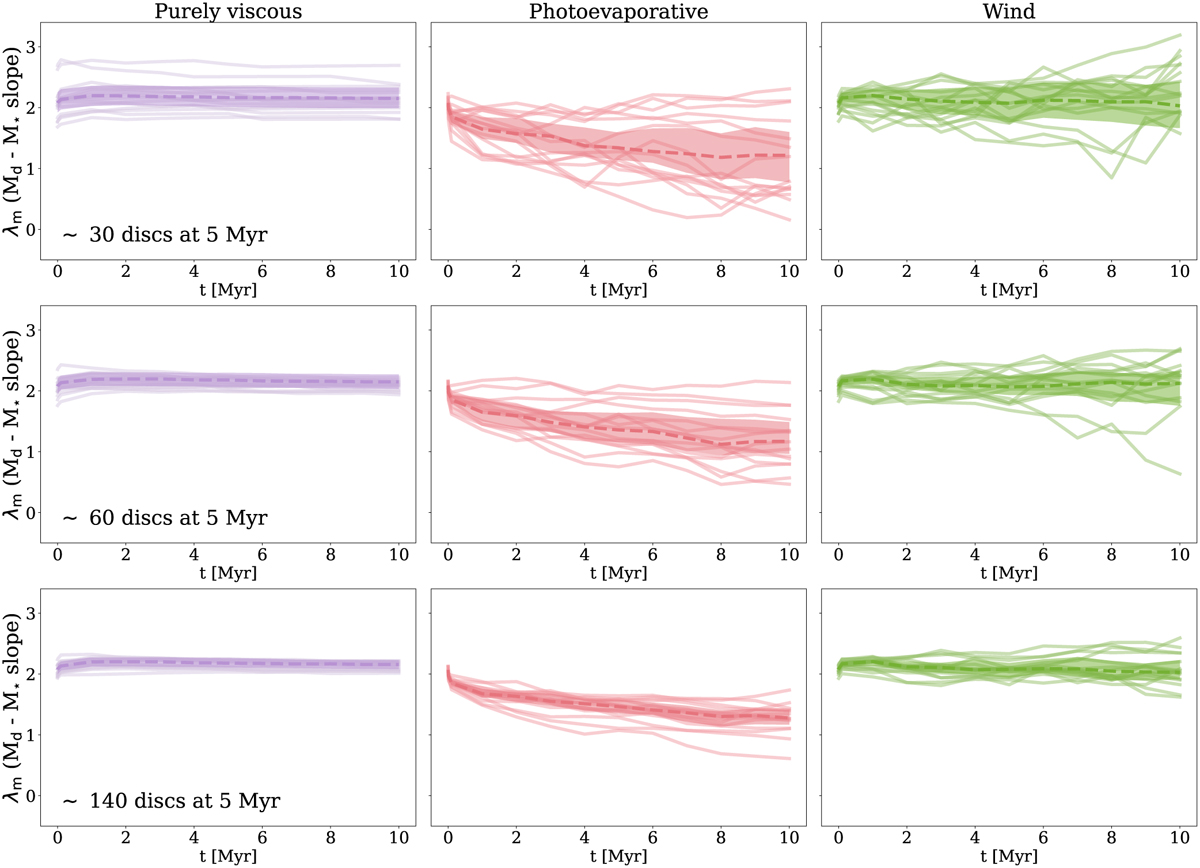
Time evolution of the slope of the Md–M* correlation for 15 statistical realisations in the purely viscous (left, αSS = 10−3), photoevaporative (centre, ![]() ), and wind-driven (right, ω = 0.25, λ = 3, αDW = 10−3) model. The dashed lines show the median evolution, while the shaded area represents the interval between the 25th and the 75th percentiles. The three rows show different sample sizes, increasing from top to bottom. The initial size of each population was chosen to obtain a certain number of discs at 5 Myr (the age of the oldest observed population, Upper Sco) with the different disc fractions. In the top row, we match the current size of the Upper Sco sample(~30 objects, Testi et al. 2022) with both accretion rate and disc mass measurements; the middle row shows double the current sample size (~60 objects), while the bottom row assumes a complete sample (~140 objects). While the viscous model produces a remarkably similar evolution for all simulations, the latter two show stochastic oscillations from one realisation to another, suggesting that disc dispersal impacts the observed slope more than the evolutionary model does – at least with the currently available sample sizes; increasing the number of sources significantly mitigates the oscillations. The slope of the
), and wind-driven (right, ω = 0.25, λ = 3, αDW = 10−3) model. The dashed lines show the median evolution, while the shaded area represents the interval between the 25th and the 75th percentiles. The three rows show different sample sizes, increasing from top to bottom. The initial size of each population was chosen to obtain a certain number of discs at 5 Myr (the age of the oldest observed population, Upper Sco) with the different disc fractions. In the top row, we match the current size of the Upper Sco sample(~30 objects, Testi et al. 2022) with both accretion rate and disc mass measurements; the middle row shows double the current sample size (~60 objects), while the bottom row assumes a complete sample (~140 objects). While the viscous model produces a remarkably similar evolution for all simulations, the latter two show stochastic oscillations from one realisation to another, suggesting that disc dispersal impacts the observed slope more than the evolutionary model does – at least with the currently available sample sizes; increasing the number of sources significantly mitigates the oscillations. The slope of the ![]() correlation behaves the same way.
correlation behaves the same way.
Current usage metrics show cumulative count of Article Views (full-text article views including HTML views, PDF and ePub downloads, according to the available data) and Abstracts Views on Vision4Press platform.
Data correspond to usage on the plateform after 2015. The current usage metrics is available 48-96 hours after online publication and is updated daily on week days.
Initial download of the metrics may take a while.