Fig. 3
Download original image
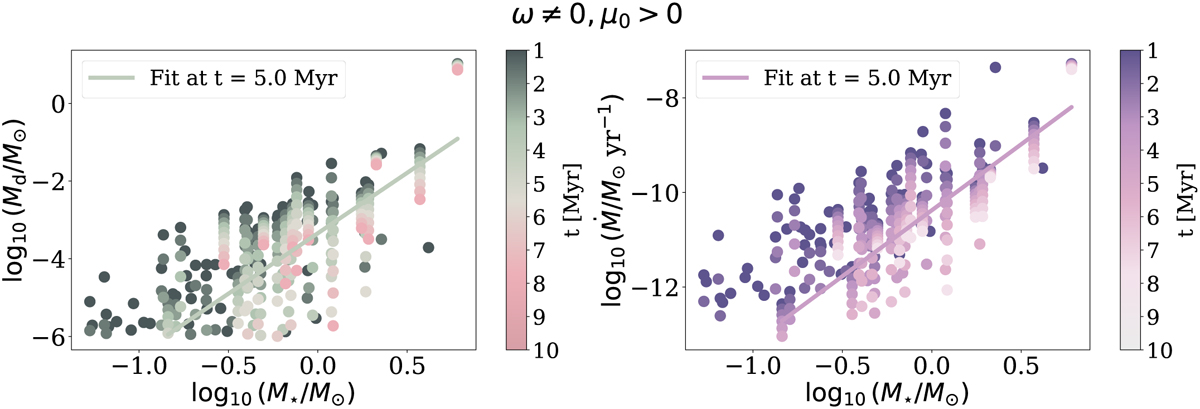
Same as Figure 2 but with the addition of a spread in the initial correlations between the disc properties and the stellar mass ![]() dex,
dex, ![]() dex). Despite the linear correlation being readily broken in theory (see Section 3.3), the scatter introduced by the spread in the initial conditions simulates the correlation also at more evolved ages. As an example, we show the fitted line at 5 Myr (the age of the oldest observed population) in both panels (log10(Md/M⊙) = 3.1 log10(M*/M⊙) − 3.3,
dex). Despite the linear correlation being readily broken in theory (see Section 3.3), the scatter introduced by the spread in the initial conditions simulates the correlation also at more evolved ages. As an example, we show the fitted line at 5 Myr (the age of the oldest observed population) in both panels (log10(Md/M⊙) = 3.1 log10(M*/M⊙) − 3.3, ![]() log10(M*/M⊙) − 10.4).
log10(M*/M⊙) − 10.4).
Current usage metrics show cumulative count of Article Views (full-text article views including HTML views, PDF and ePub downloads, according to the available data) and Abstracts Views on Vision4Press platform.
Data correspond to usage on the plateform after 2015. The current usage metrics is available 48-96 hours after online publication and is updated daily on week days.
Initial download of the metrics may take a while.