Fig. 1
Download original image
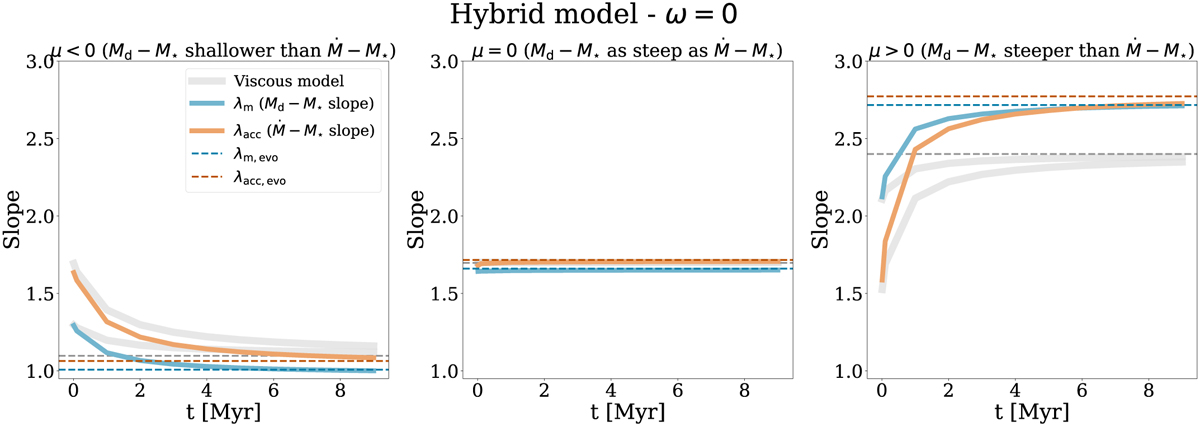
Time evolution of the slopes of the Md − M* and ![]() correlations, λm and λacc (blue and orange solid line, respectively) in the hybrid scenario with αSS = αDW = 10−3 (ψ = 1), λ = 3, β = 0.5, resulting in ξ = 0.11. The dashed lines represent the expected evolved value of both slopes, as in Equation (12). For comparison, we include the viscous evolution as well, represented by grey solid (actual evolution) and dashed (expected evolved value) lines (see Somigliana et al. 2022 for a detailed discussion). The three panels show different values of μ0, slope of the tacc,0 − M* correlation, which is directly linked to the difference between λm,0 and λacc,0 (see text for details): we expect the slopes to (i) decrease if μ0 < 0 (left panel), (ii) remain constant if μ0 = 0 (central panel), and (iii) increase if μ0 > 0 (right panel). Contrary to the viscous case, the slopes are not expected to reach the same value anymore, but rather settle to a constant difference of −ξ/2. This difference is always negative, meaning that the evolved
correlations, λm and λacc (blue and orange solid line, respectively) in the hybrid scenario with αSS = αDW = 10−3 (ψ = 1), λ = 3, β = 0.5, resulting in ξ = 0.11. The dashed lines represent the expected evolved value of both slopes, as in Equation (12). For comparison, we include the viscous evolution as well, represented by grey solid (actual evolution) and dashed (expected evolved value) lines (see Somigliana et al. 2022 for a detailed discussion). The three panels show different values of μ0, slope of the tacc,0 − M* correlation, which is directly linked to the difference between λm,0 and λacc,0 (see text for details): we expect the slopes to (i) decrease if μ0 < 0 (left panel), (ii) remain constant if μ0 = 0 (central panel), and (iii) increase if μ0 > 0 (right panel). Contrary to the viscous case, the slopes are not expected to reach the same value anymore, but rather settle to a constant difference of −ξ/2. This difference is always negative, meaning that the evolved ![]() correlation is always steeper than that of Md–M* (explaining the lines crossing in the right panel).
correlation is always steeper than that of Md–M* (explaining the lines crossing in the right panel).
Current usage metrics show cumulative count of Article Views (full-text article views including HTML views, PDF and ePub downloads, according to the available data) and Abstracts Views on Vision4Press platform.
Data correspond to usage on the plateform after 2015. The current usage metrics is available 48-96 hours after online publication and is updated daily on week days.
Initial download of the metrics may take a while.