Fig. 1
Download original image
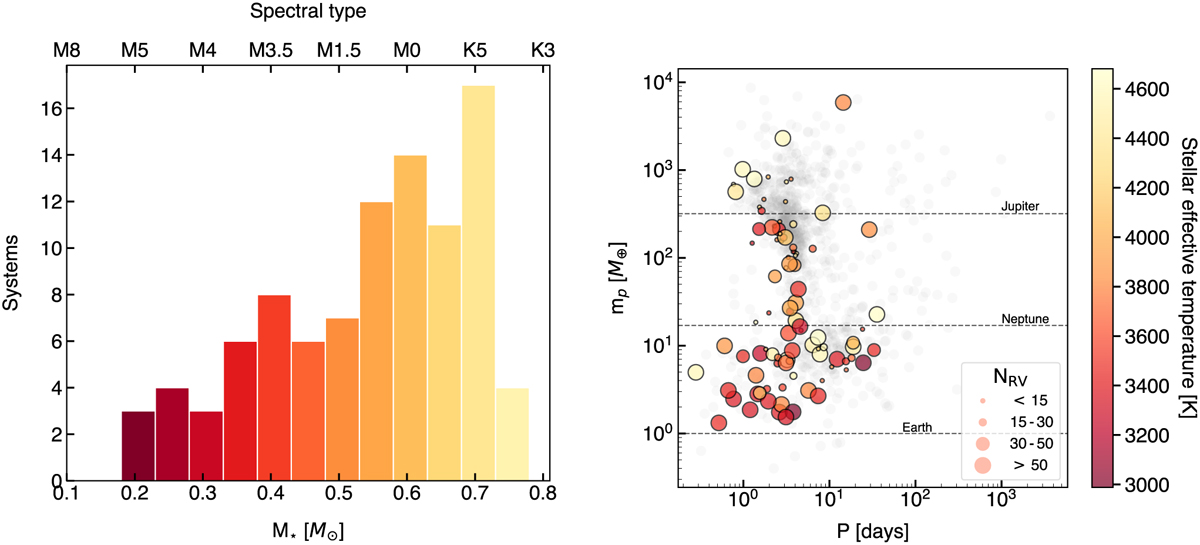
Sample of the study. Left: distribution of the stellar spectral type (color coded by the effective temperature). Right: period-mass diagram for all confirmed planets excluding those discovered by the imaging technique. Colored symbols correspond to the targets from our sample selected as explained in Sec. 2, where the color code indicates the effective temperature of the host star. The size of the colored dots informs on the number of RV measurements available for this work as indicated in the legend. The three horizontal lines show the masses of Jupiter, Neptune, and Earth for reference.
Current usage metrics show cumulative count of Article Views (full-text article views including HTML views, PDF and ePub downloads, according to the available data) and Abstracts Views on Vision4Press platform.
Data correspond to usage on the plateform after 2015. The current usage metrics is available 48-96 hours after online publication and is updated daily on week days.
Initial download of the metrics may take a while.