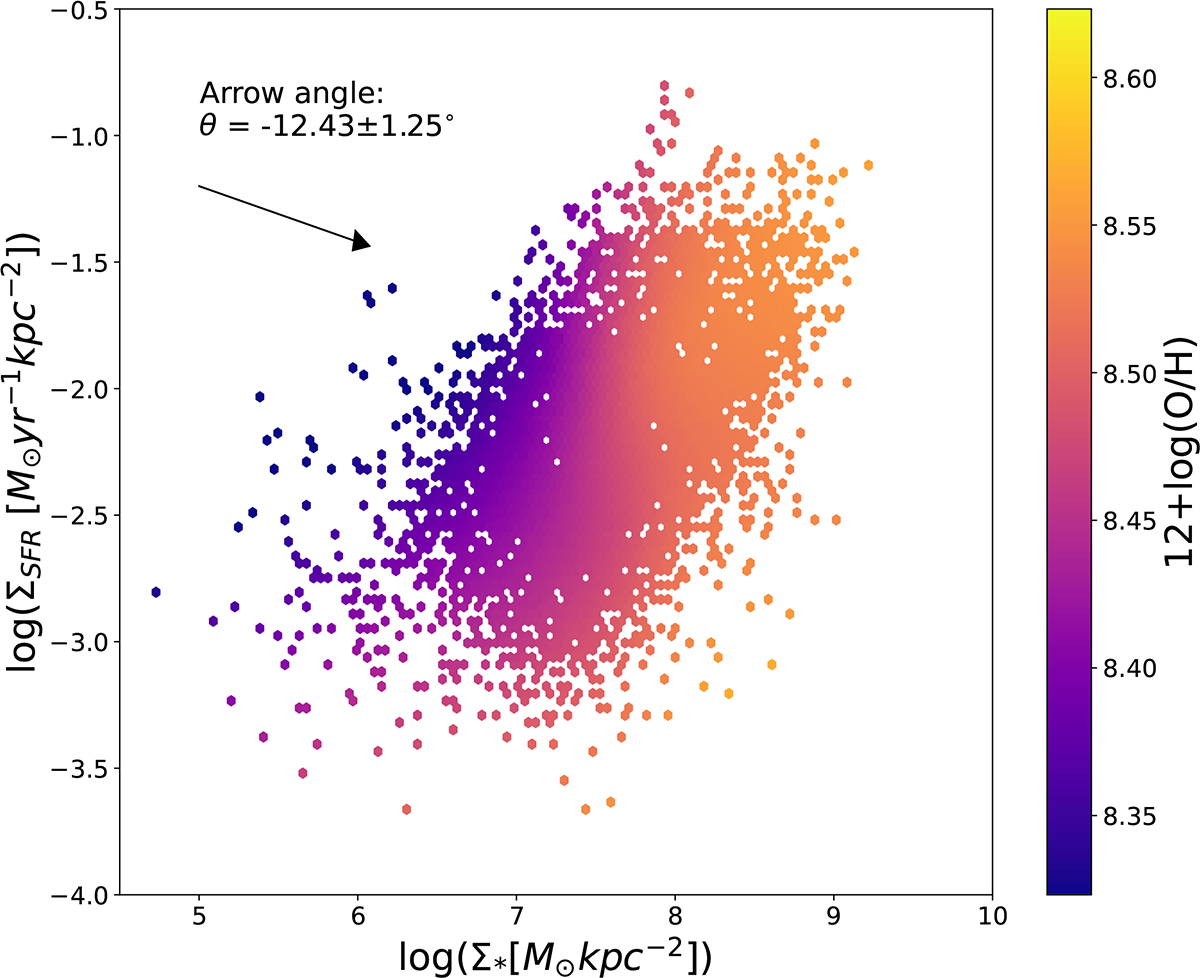
Fig. 7.
Download original image
Resolved fundamental metallicity relation for the star-forming spaxels of our sample. Here, log(Σ*) is plotted against log(ΣSFR) and each spaxel is color-coded by its gas-phase metallicity 12 + log(O/H). Additionally, an arrow angle and its error point to the direction of the steepest average gradient of increase of the local metallicity. Images are smoothed over via LOESS (Cappellari et al. 2013), a locally weighted regression method to compute mean trends of the population from noisy data.
Current usage metrics show cumulative count of Article Views (full-text article views including HTML views, PDF and ePub downloads, according to the available data) and Abstracts Views on Vision4Press platform.
Data correspond to usage on the plateform after 2015. The current usage metrics is available 48-96 hours after online publication and is updated daily on week days.
Initial download of the metrics may take a while.