Fig. 6.
Download original image
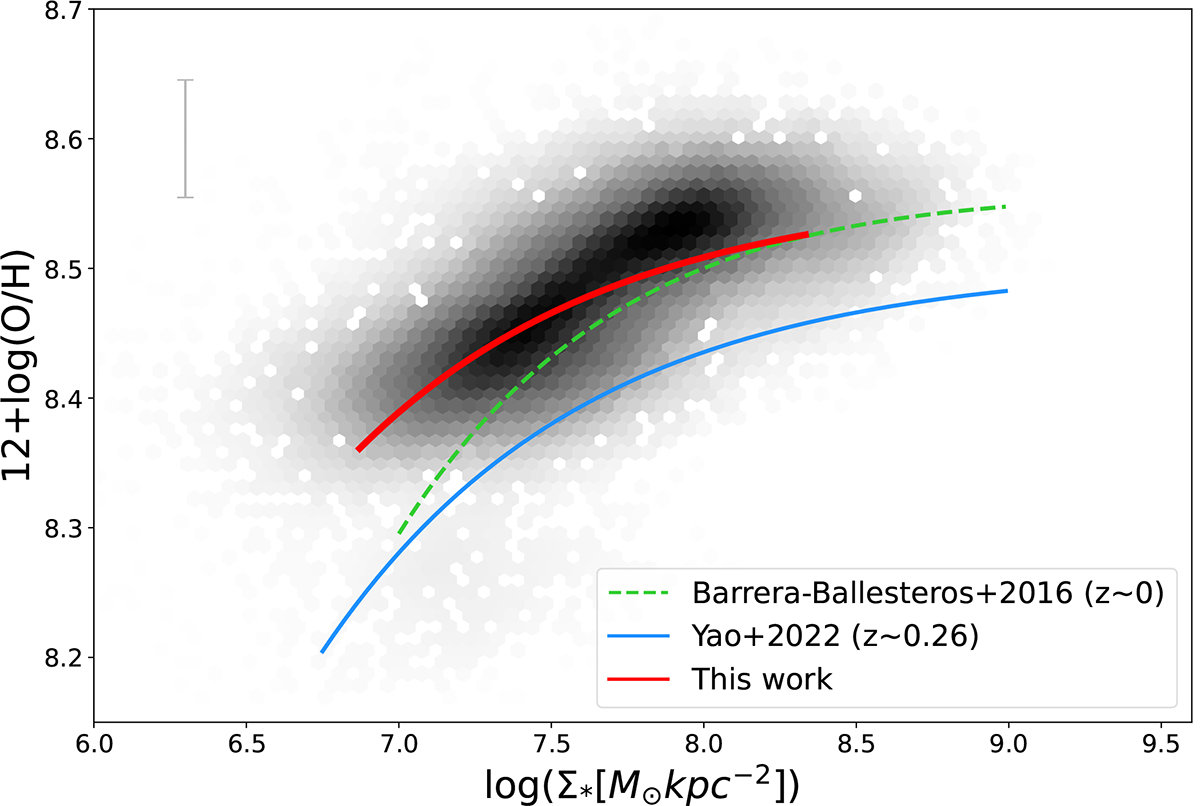
Distribution of the gas-phase metallicities of our sample of star-forming spaxels against their stellar mass surface densities. The hexagonal bins depict the sample distribution with darker colors corresponding to a denser region of data points. The corresponding fitting result for our data within a mass range of 6.87 ≲ log Σ∗ (M⊙ kpc−2) ≲ 8.33, which is defined as the range that covers 80% of the data, was computed via Eq. (7) from Sánchez et al. (2013) and is shown as a red line. The gray errorbar in the top left corner shows the average uncertainties in gas-phase metallicity and Σ*. FADO only gives errors based on the goodness of the fit, stellar mass errors are very small, and the average Σ* is not visible within this plot.
Current usage metrics show cumulative count of Article Views (full-text article views including HTML views, PDF and ePub downloads, according to the available data) and Abstracts Views on Vision4Press platform.
Data correspond to usage on the plateform after 2015. The current usage metrics is available 48-96 hours after online publication and is updated daily on week days.
Initial download of the metrics may take a while.