Fig. 5.
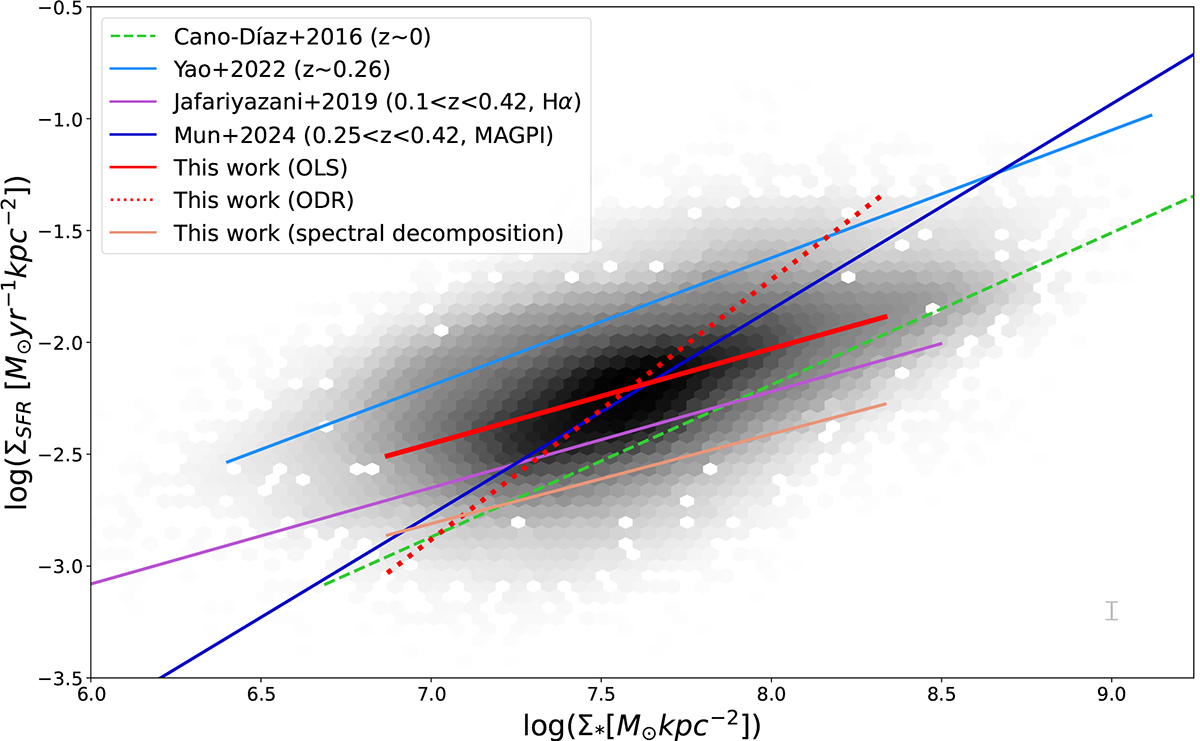
Download original image
Results of the rSFMS compared to other works. The gray hexagonal bins depict the distribution of our data points, estimated via Gaussian kernels, where darker bins correspond to a higher density of data points. The solid red line represents our results using an ordinary least square (OLS) fitting and the dotted red line is for an orthogonal distance regression (ODR). The solid blue line is the result of Yao et al. (2022) at z ∼ 0.26, and the solid purple line is of Jafariyazani et al. (2019) at 0.1 < z < 0.42, both of which cover a similar redshift range to ours. The dashed green line comes from Cano-Díaz et al. (2016) for the local Universe. As a comparison, we also present our results via OLS when applying the spectral decomposition method from Davies et al. (2017) (see Sect. 4.1.2) as a pink line. The gray errorbar shows the average uncertainties in ΣSFR and Σ*. FADO only gives errors based on the goodness of the fit, stellar mass errors are very small, and the average Σ* is not visible within this plot.
Current usage metrics show cumulative count of Article Views (full-text article views including HTML views, PDF and ePub downloads, according to the available data) and Abstracts Views on Vision4Press platform.
Data correspond to usage on the plateform after 2015. The current usage metrics is available 48-96 hours after online publication and is updated daily on week days.
Initial download of the metrics may take a while.