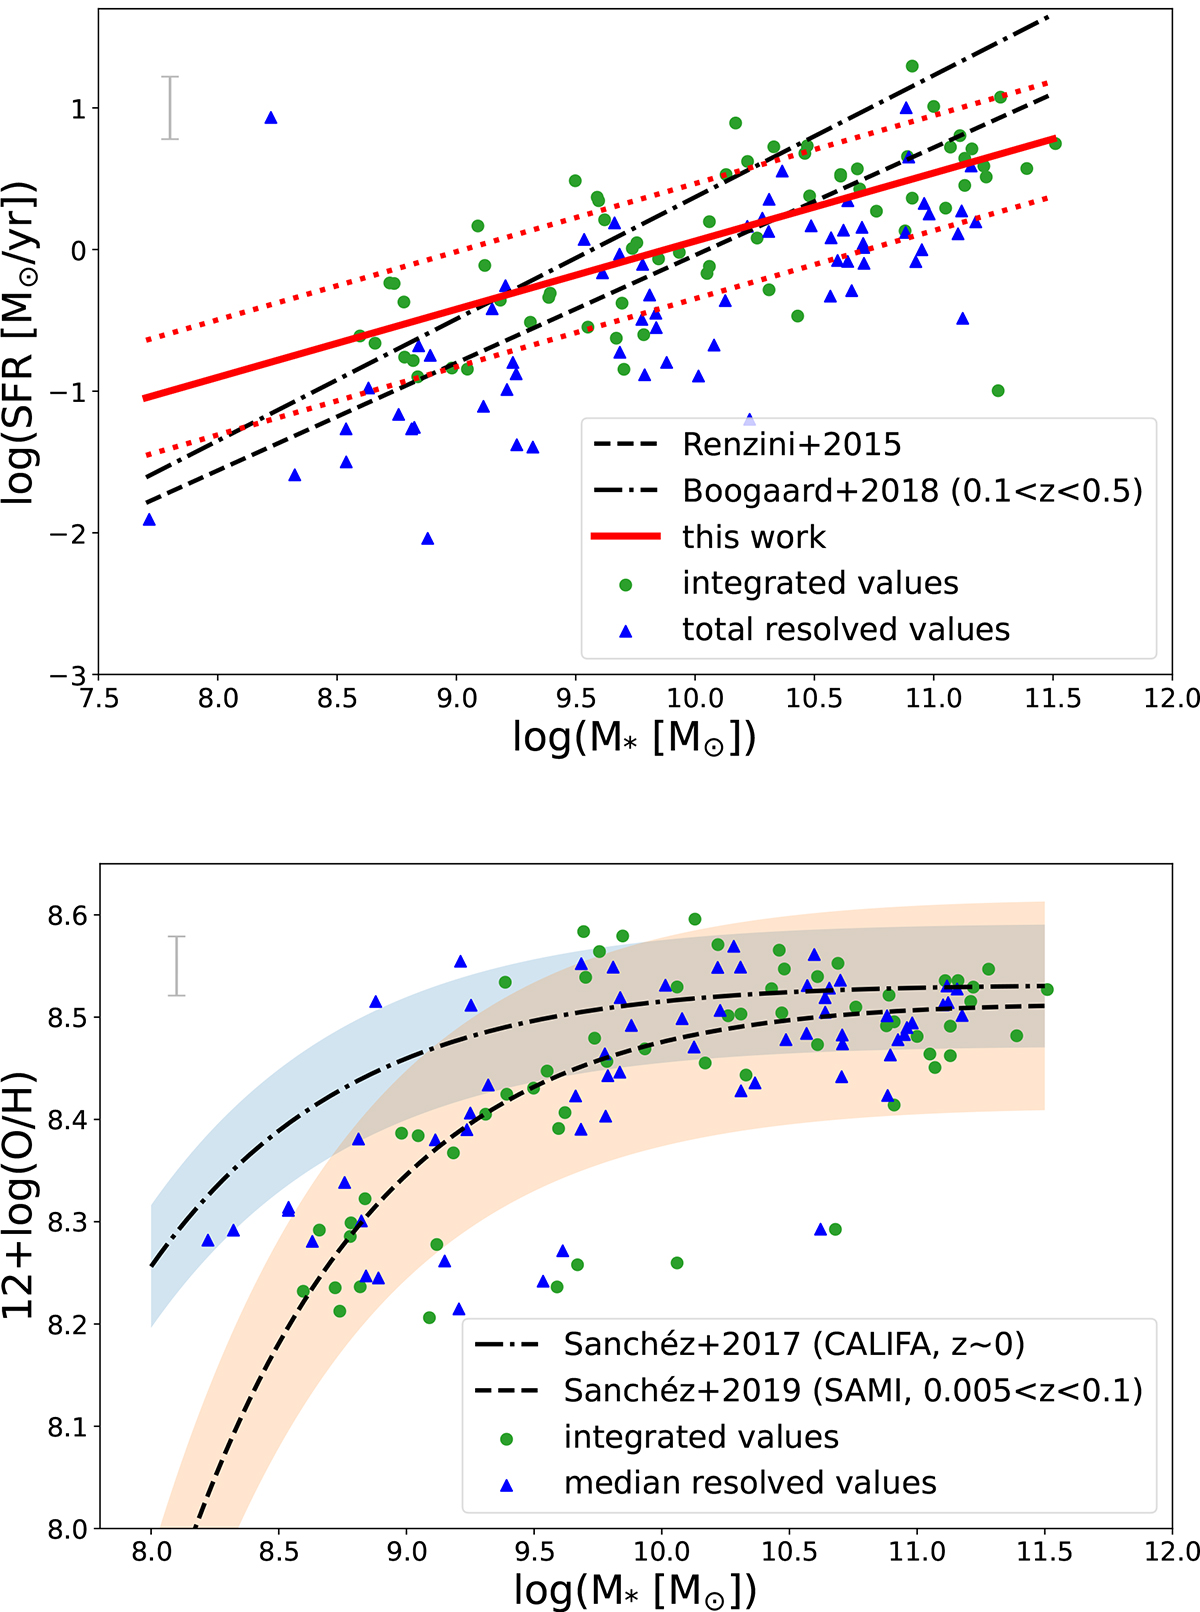
Fig. 4.
Download original image
Global relations for our sample. Top: Global SFMS. The green circles depict the integrated measurements for SFR and M*, while the blue triangles represent the sum of all the resolved spaxel values within each galaxy. The dashed black line represents the fit from Renzini & Peng (2015). The dash-dotted black line shows the fit from Boogaard et al. (2018). Our own linear fit results are shown in red with its ∼0.4 dex scatter as a dotted red line. Bottom: Global MZR. The integrated 12 + log(O/H) as green circles are calculated using the integrated flux measurements, while the blue triangles represent the median resolved gas-phase metallicity of each galaxy. The dashed black line and 0.102 dex scatter in orange represents the MZR fit from Sánchez et al. (2019) while the dotted black line and 0.06 dex scatter in blue stems from Sánchez et al. (2017).
Current usage metrics show cumulative count of Article Views (full-text article views including HTML views, PDF and ePub downloads, according to the available data) and Abstracts Views on Vision4Press platform.
Data correspond to usage on the plateform after 2015. The current usage metrics is available 48-96 hours after online publication and is updated daily on week days.
Initial download of the metrics may take a while.