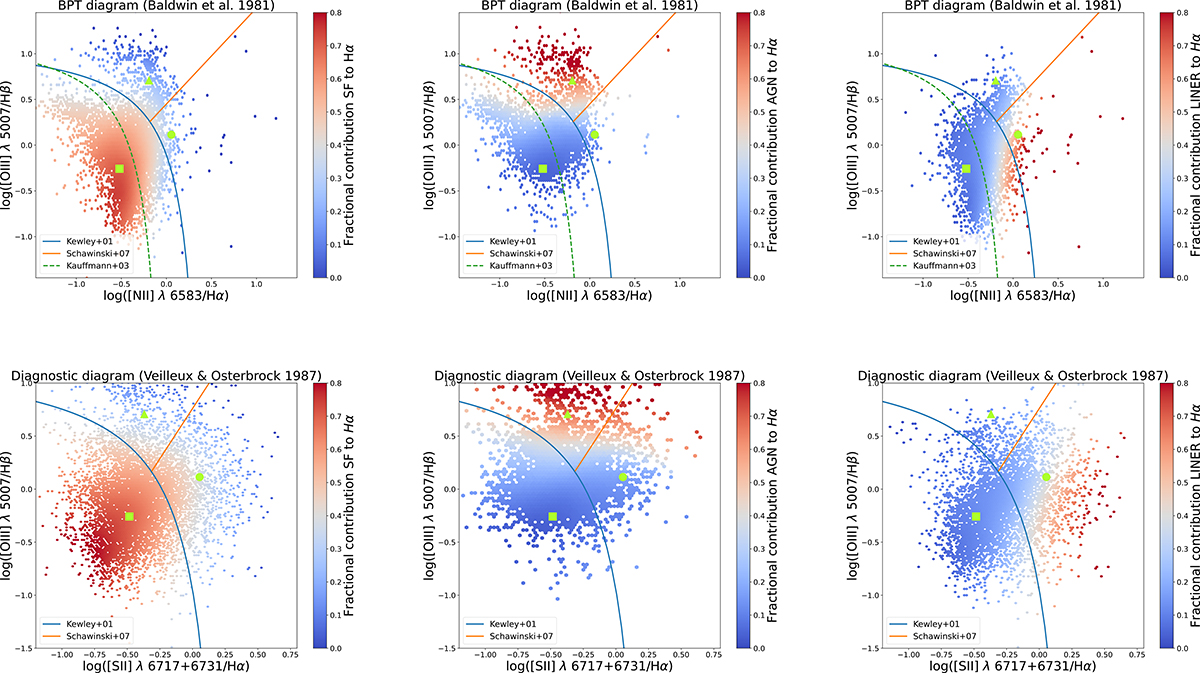
Fig. 3.
Download original image
Diagnostic diagrams by Baldwin et al. (1981) (top row) and Veilleux & Osterbrock (1987) (bottom row) with emission line flux ratios extracted from the total emission line fluxes of the individual spaxels. The lime green icons indicate the base spectra for star formation (square), AGN emission (circle), and LINER emission (triangle). Our data points shown here are color-coded using the fraction of Hα emission that is ascribable to SF (left), AGN emission (middle), and LINER emission (right). The data points are smoothed over via LOESS (Cappellari et al. 2013).
Current usage metrics show cumulative count of Article Views (full-text article views including HTML views, PDF and ePub downloads, according to the available data) and Abstracts Views on Vision4Press platform.
Data correspond to usage on the plateform after 2015. The current usage metrics is available 48-96 hours after online publication and is updated daily on week days.
Initial download of the metrics may take a while.