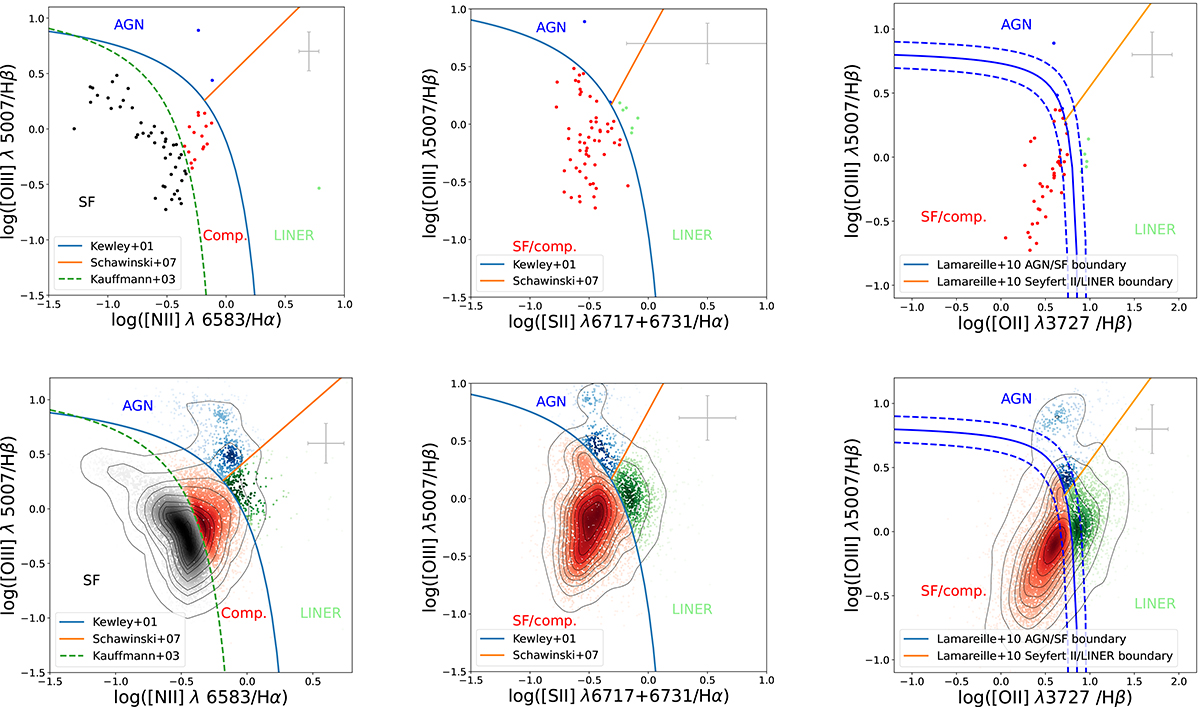
Fig. 2.
Download original image
Global and spatially resolved diagnostic diagrams. Top: Diagnostic diagrams by Baldwin et al. (1981) (left), Veilleux & Osterbrock (1987) (middle), and Lamareille (2010) (right) for the galaxies’ integrated flux measurements. The gray error bars in the top right indicate all diagrams’ mean flux ratio errors along the x- and y-axis. In the case of the Lamareille (2010) diagram, only galaxies with [OII]λ3727 measurements via FADO were included. Bottom: The same diagnostic diagram of all spaxels satisfying the S/N > 3 criteria in all four emission lines – [OIII]5006 Å, Hβ, Hα, and [NII]6585 Å. The diagnostic diagram by Baldwin et al. (1981) distinguishes between star-forming (black), composite (red), AGN (blue), and LINER (green) emission while the diagrams by Lamareille (2010) and Veilleux & Osterbrock (1987) both only differentiate between star-forming and possibly composite (red), AGN (blue), and LINER (green).
Current usage metrics show cumulative count of Article Views (full-text article views including HTML views, PDF and ePub downloads, according to the available data) and Abstracts Views on Vision4Press platform.
Data correspond to usage on the plateform after 2015. The current usage metrics is available 48-96 hours after online publication and is updated daily on week days.
Initial download of the metrics may take a while.