Fig. 1.
Download original image
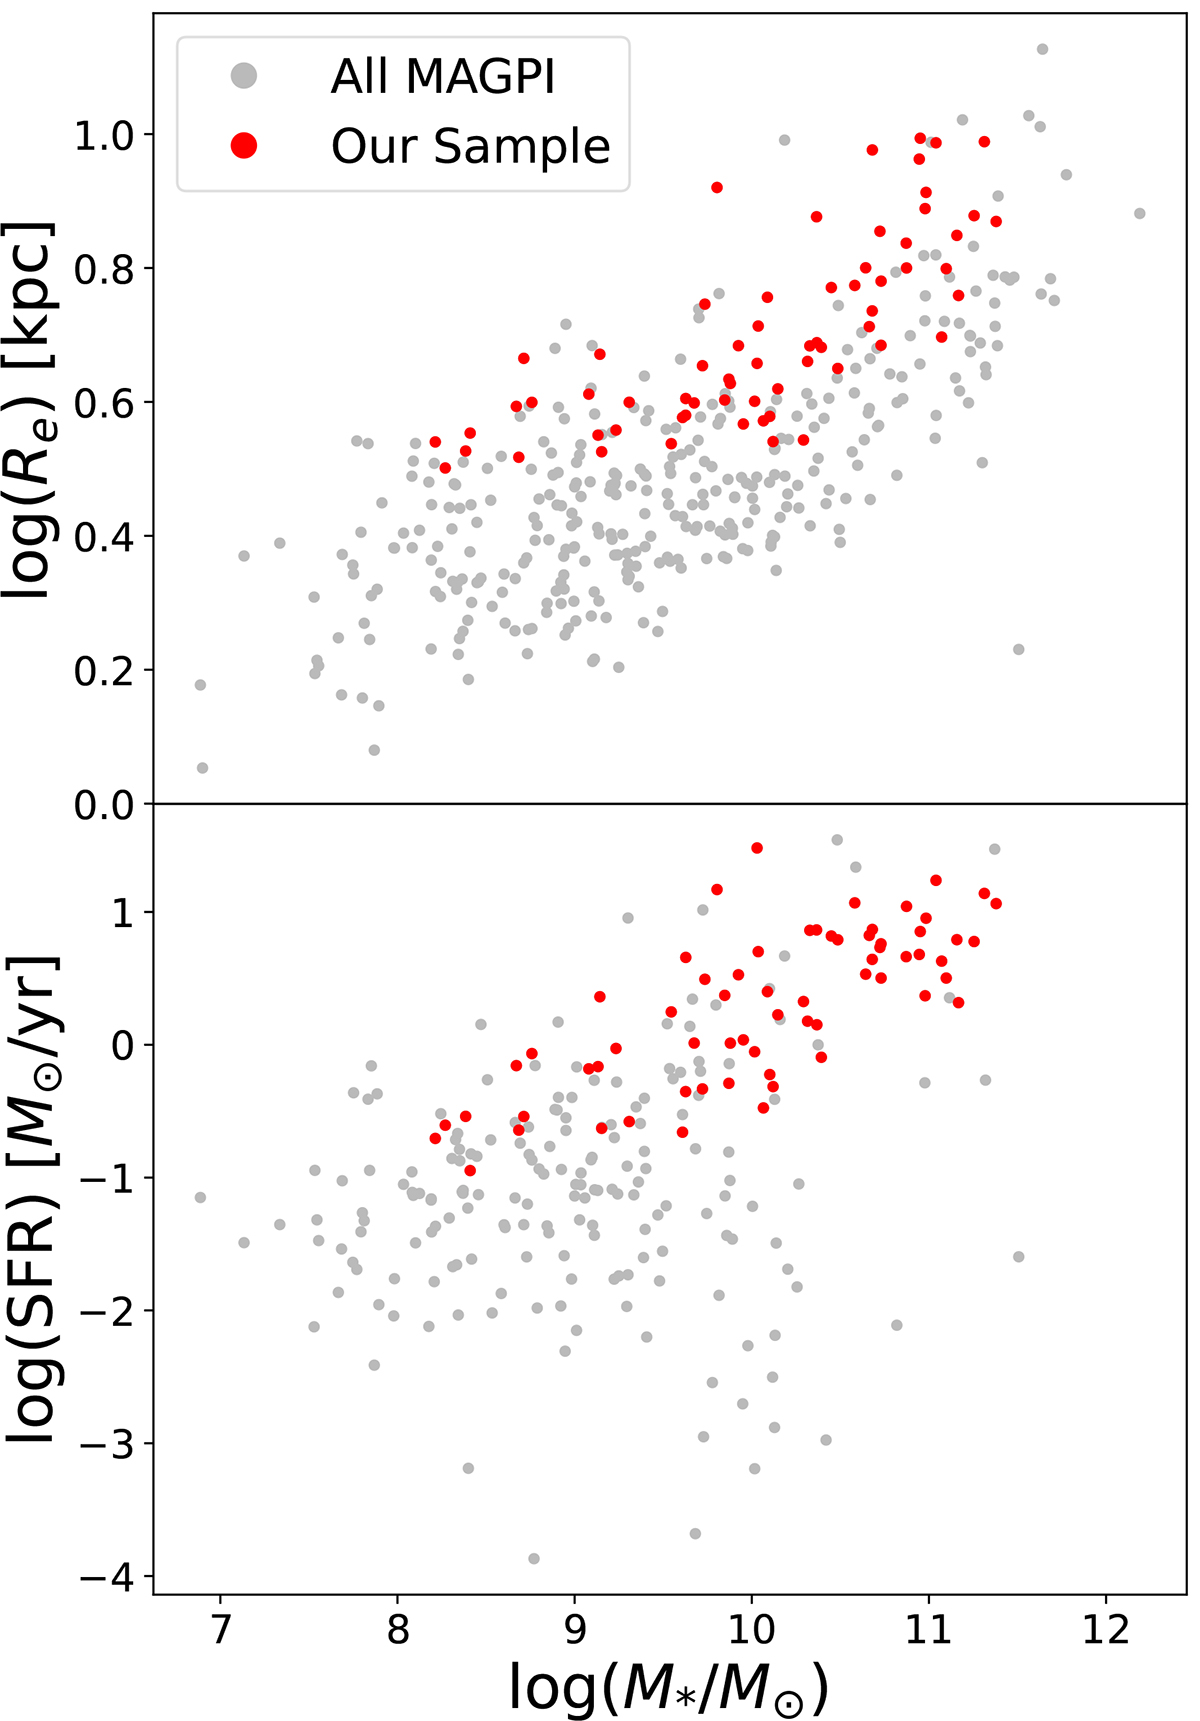
Distribution of our selected sample. Top: Mass-size diagram for our selected galaxies (red) vs. the entire MAGPI catalog within the same redshift range of 0.28 < z < 0.35 as us (gray). Stellar masses were taken from MAGPI’s ProSpect catalog and effective radii from MAGPI’s Profound catalog. Bottom: Mass-SFR diagram via SFRs derived from integrated Hα fluxes taken from MAGPI’s GIST measurements.
Current usage metrics show cumulative count of Article Views (full-text article views including HTML views, PDF and ePub downloads, according to the available data) and Abstracts Views on Vision4Press platform.
Data correspond to usage on the plateform after 2015. The current usage metrics is available 48-96 hours after online publication and is updated daily on week days.
Initial download of the metrics may take a while.