Fig. 9.
Download original image
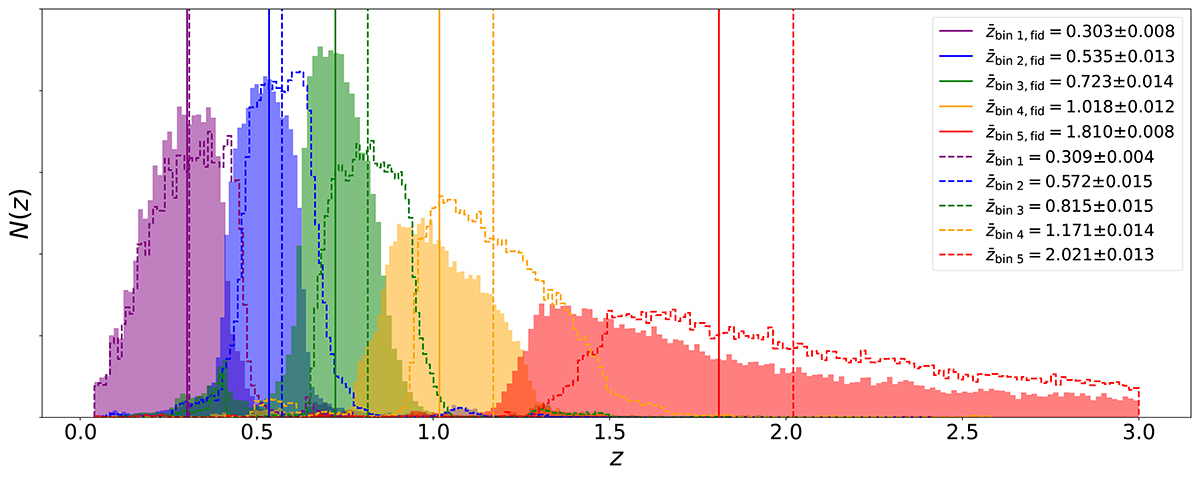
Redshift distribution N(z) of two sets of five tomographic bins built with the prescription highlighted in Sect. 6. The filled histograms refer to the N(z)s built with the fiducial sample, while the histograms with the dashed outlines represent the N(z)s built using the ‘Calzetti k(λ)’ component. The solid and dashed vertical lines represent the mean of the tomographic bins for the fiducial and the ‘Calzetti k(λ)’ components, respectively. The legend shows the tomographic bin means and 1σ errors on the means. We use the ‘Calzetti k(λ)’ component to demonstrate our analysis methodology as it induces the largest shift in the N(z). The shift is caused by the brighter rest-frame UV emission that the ‘Calzetti k(λ)’ component induces (see Fig. 4). This leaves the low-redshift galaxy observables unaffected, while it brightens high-redshift galaxies in the observed optical bands, hence making them more numerous in a magnitude-limited sample.
Current usage metrics show cumulative count of Article Views (full-text article views including HTML views, PDF and ePub downloads, according to the available data) and Abstracts Views on Vision4Press platform.
Data correspond to usage on the plateform after 2015. The current usage metrics is available 48-96 hours after online publication and is updated daily on week days.
Initial download of the metrics may take a while.