Fig. 8.
Download original image
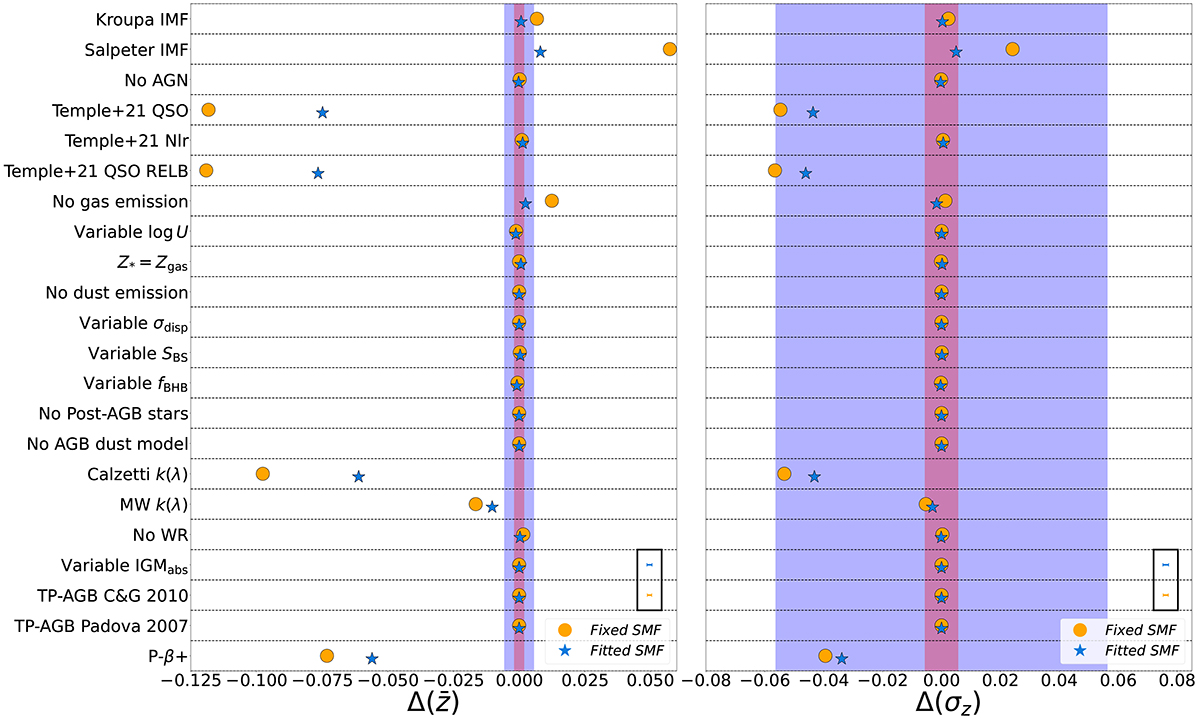
Differences ![]() between the mean of the fiducial magnitude-limited (i ≤ 25.3) redshift distribution and those obtained from the magnitude-limited redshift distributions for each varied SED modelling component (left panel). The right panel instead shows the differences Δ(σz)comp on the redshift distributions scatter. The light blue stars refer to the case where the total number of galaxies for each magnitude-selected sample is matched to the fiducial number of objects via an overall magnitude offset (‘Fitted SMF’), while the orange circles refer to the unmatched case (‘Fixed SMF’). We report the mean errors on
between the mean of the fiducial magnitude-limited (i ≤ 25.3) redshift distribution and those obtained from the magnitude-limited redshift distributions for each varied SED modelling component (left panel). The right panel instead shows the differences Δ(σz)comp on the redshift distributions scatter. The light blue stars refer to the case where the total number of galaxies for each magnitude-selected sample is matched to the fiducial number of objects via an overall magnitude offset (‘Fitted SMF’), while the orange circles refer to the unmatched case (‘Fixed SMF’). We report the mean errors on ![]() and Δ(σz)comp estimated via bootstrap resampling in the black boxes in the bottom right-hand corner of each subplot. The blue and red bars show the systematic uncertainty requirements on the redshift distribution mean and scatter for the galaxy clustering and weak lensing 3 × 2 pt analysis of Rubin-LSST Y10, as detailed in Mandelbaum et al. (2018).
and Δ(σz)comp estimated via bootstrap resampling in the black boxes in the bottom right-hand corner of each subplot. The blue and red bars show the systematic uncertainty requirements on the redshift distribution mean and scatter for the galaxy clustering and weak lensing 3 × 2 pt analysis of Rubin-LSST Y10, as detailed in Mandelbaum et al. (2018).
Current usage metrics show cumulative count of Article Views (full-text article views including HTML views, PDF and ePub downloads, according to the available data) and Abstracts Views on Vision4Press platform.
Data correspond to usage on the plateform after 2015. The current usage metrics is available 48-96 hours after online publication and is updated daily on week days.
Initial download of the metrics may take a while.