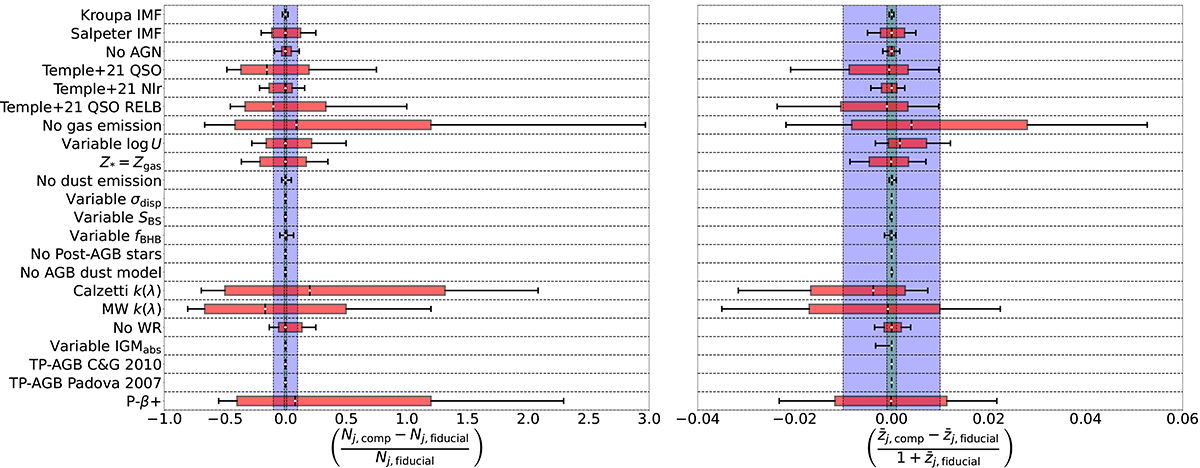
Fig. 7.
Download original image
Distributions of the relative difference in the cell occupation number (left panel) and in the cell mean redshift (right panel) with respect to the fiducial case. For each pair of fiducial and variable component model, we consider only the cells that are populated by both galaxy samples. The relative differences in the cell occupation number are shown as (Nj, comp − Nj, fiducial)/Nj, fiducial for clarity. The black vertical bars and the white dots on top of them represent the median value of (Nj, comp − Nj, fiducial)/Nj, fiducial, the boxes represent the 75th–25th percentile ranges and the whiskers represent the 84th–16th percentile ranges. The light green and light blue areas show the regions where the relative difference is within −0.1 ≤ (Nj, comp − Nj, fiducial)/Nj, fiducial ≤ 0.1 and −0.01 ≤ (Nj, comp − Nj, fiducial)/Nj, fiducial ≤ 0.01, respectively. The right panel shows the distributions of the differences in the mean redshift per cell between the fiducial case and the SED components variation cases normalised by 1 + z. The elements on the plot have the same meaning, but the light green and light blue areas show instead the regions where the relative difference of cell mean redshift is within ![]() and
and ![]() , respectively.
, respectively.
Current usage metrics show cumulative count of Article Views (full-text article views including HTML views, PDF and ePub downloads, according to the available data) and Abstracts Views on Vision4Press platform.
Data correspond to usage on the plateform after 2015. The current usage metrics is available 48-96 hours after online publication and is updated daily on week days.
Initial download of the metrics may take a while.