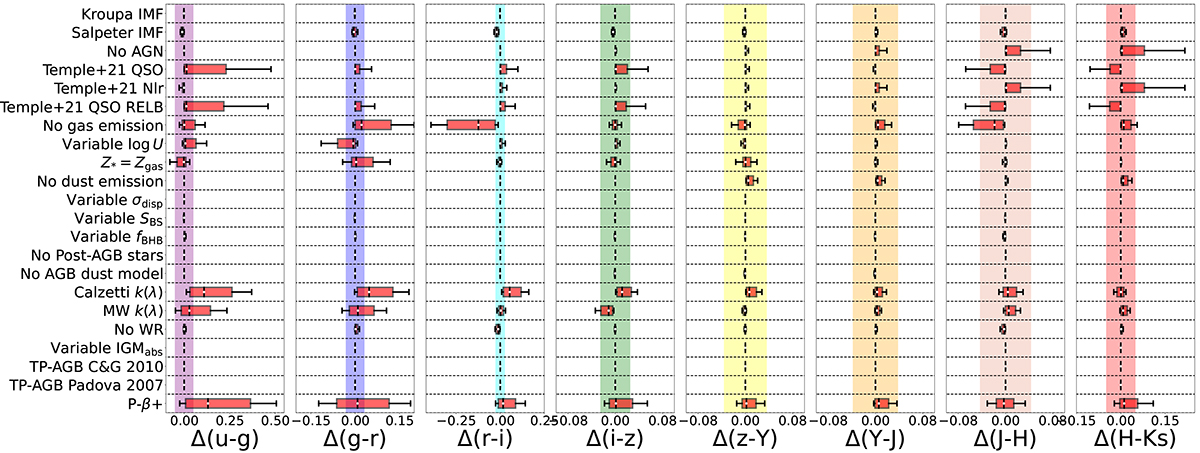
Fig. 5.
Download original image
Rest-frame colour differences between the fiducial galaxy sample (PROSPECTOR-β) and those obtained modifying one stellar population component at the time (y-axis labels). The coloured widths are the sum in quadrature of COSMOS median photometric errors in the two respective bands to indicate distinguishability on a single galaxy basis. The vertical black bars and the white dots on top of them represent the median values of each rest-frame colour difference. The light red boxes show the interquartile range (75th–25th percentile), while the whiskers represent the 84th–16th percentile ranges.
Current usage metrics show cumulative count of Article Views (full-text article views including HTML views, PDF and ePub downloads, according to the available data) and Abstracts Views on Vision4Press platform.
Data correspond to usage on the plateform after 2015. The current usage metrics is available 48-96 hours after online publication and is updated daily on week days.
Initial download of the metrics may take a while.