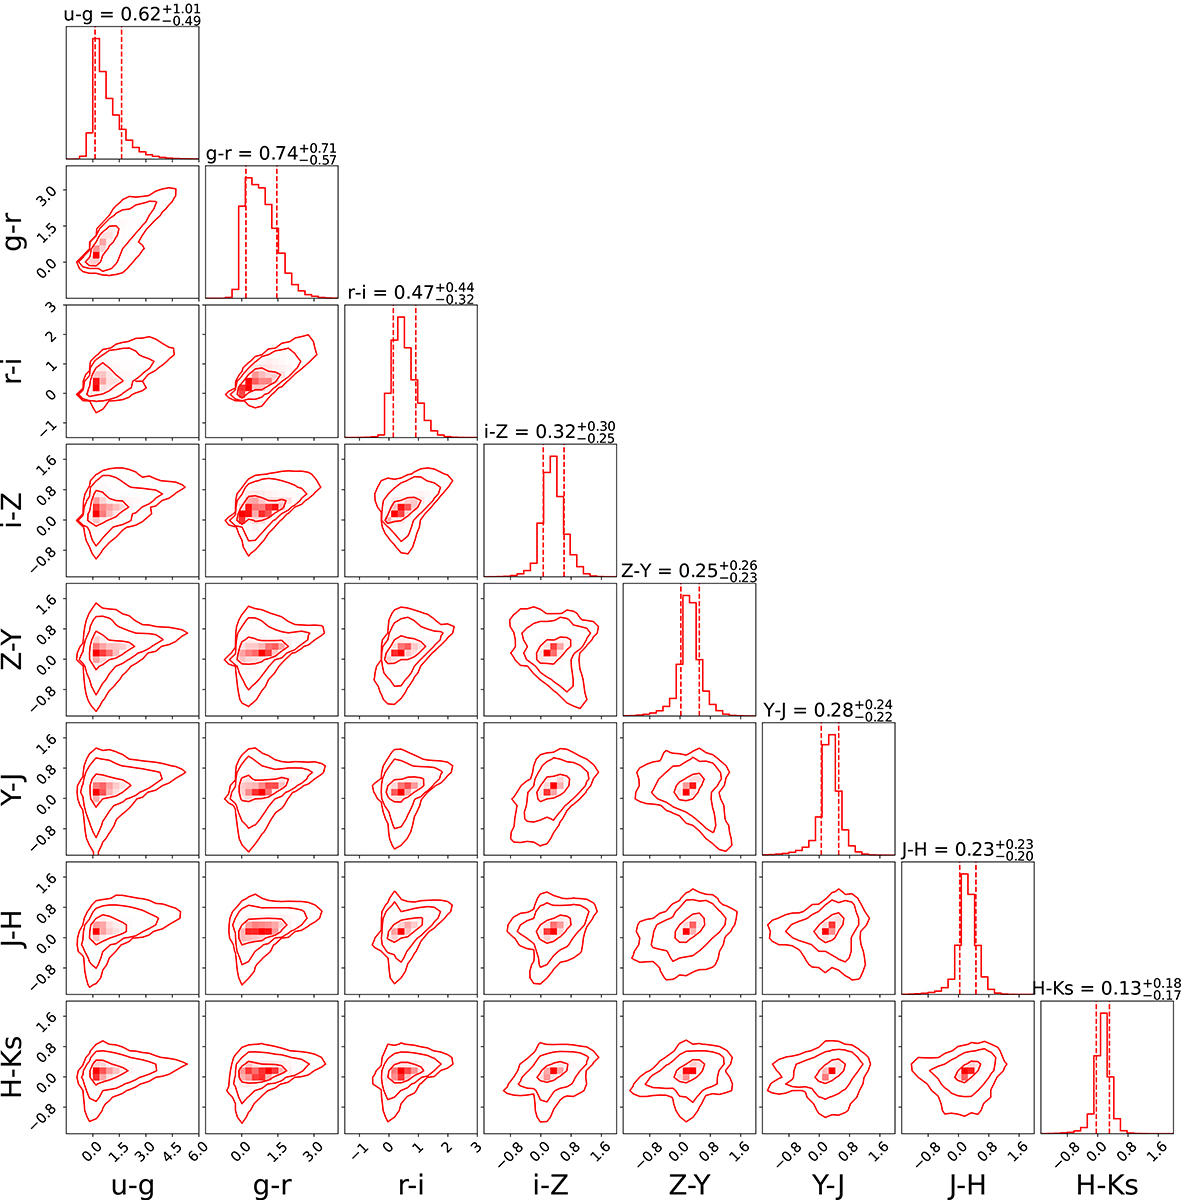
Fig. 2.
Download original image
Distribution of model colours obtained from the sample of 106 galaxies drawn from the PROSPECTOR-β model. The colours are obtained using mock apparent magnitudes in the KiDS-VIKING ugriZYJHKs bands. We display the 16th, 50th, and 84th quantile values for each colour at the top of the corresponding 1D histogram. The dotted lines in each 1D histogram are the 16th and 84th quantile values. The 2D contours enclose the 68%, 95%, and 99% of the values.
Current usage metrics show cumulative count of Article Views (full-text article views including HTML views, PDF and ePub downloads, according to the available data) and Abstracts Views on Vision4Press platform.
Data correspond to usage on the plateform after 2015. The current usage metrics is available 48-96 hours after online publication and is updated daily on week days.
Initial download of the metrics may take a while.