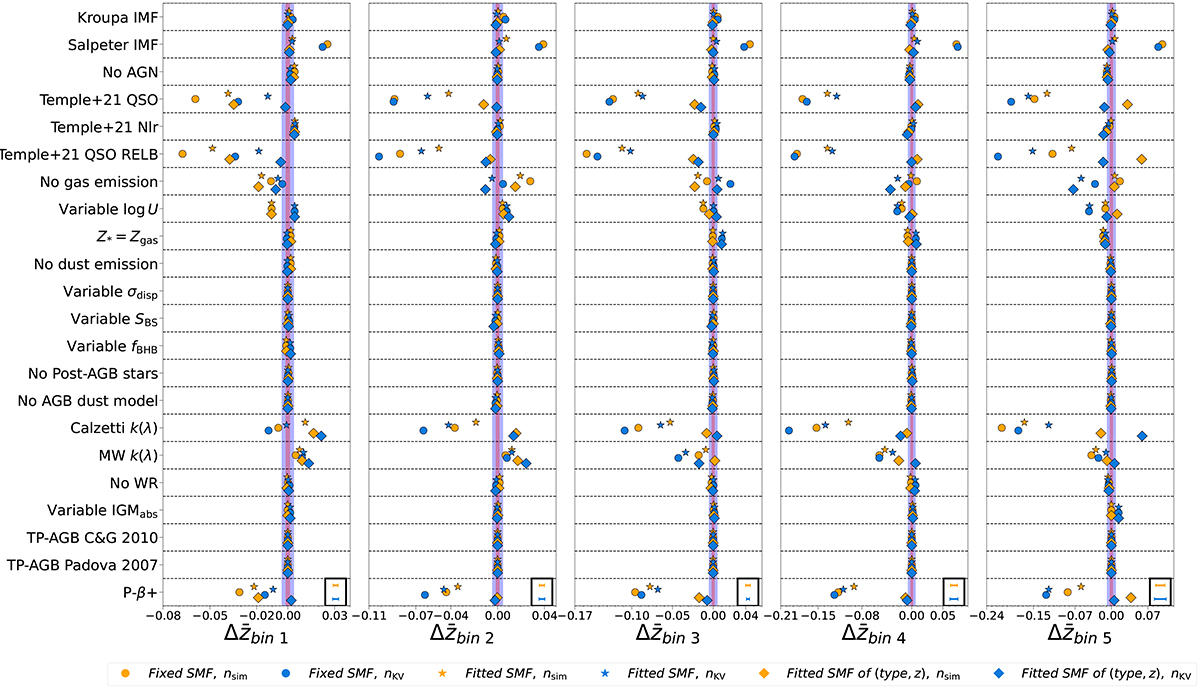
Fig. 10.
Download original image
Impact of varying the choices of the SED modelling component on the mean of the tomographic redshift distribution bins. Each panel shows a different tomographic bin, from the lowest (left-most) to the highest (right-most) redshift one. Each row represents a different SED modelling component we vary. The scatter points represent the difference between the mean redshift per bin obtained with the fiducial PROSPECTOR-β model and that obtained by varying one SED modelling component at the time. Orange scatter points are obtained by weighting the P(z|ci) for the number of simulated galaxies per SOM cell, while light blue points are obtained by weighting the P(z|ci) for the observed abundances in the Masters et al. (2015), McCullough et al. (2024) SOM cells. Circle-shaped, star-shaped and diamond-shaped scatter points refer to the cases where we perform an i-band magnitude-selection of the sample of galaxies that is different for each component, matched for the total number of galaxies and based on the fiducial i-band distribution, respectively. We report the mean errors on the difference of the tomographic bin means estimated via bootstrap resampling in the black boxes in the bottom right-hand corner of each subplot. The blue and red coloured bands refer to the Rubin-LSST Y10 galaxy clustering and weak lensing requirements, respectively.
Current usage metrics show cumulative count of Article Views (full-text article views including HTML views, PDF and ePub downloads, according to the available data) and Abstracts Views on Vision4Press platform.
Data correspond to usage on the plateform after 2015. The current usage metrics is available 48-96 hours after online publication and is updated daily on week days.
Initial download of the metrics may take a while.