Open Access
Fig. 9.
Download original image
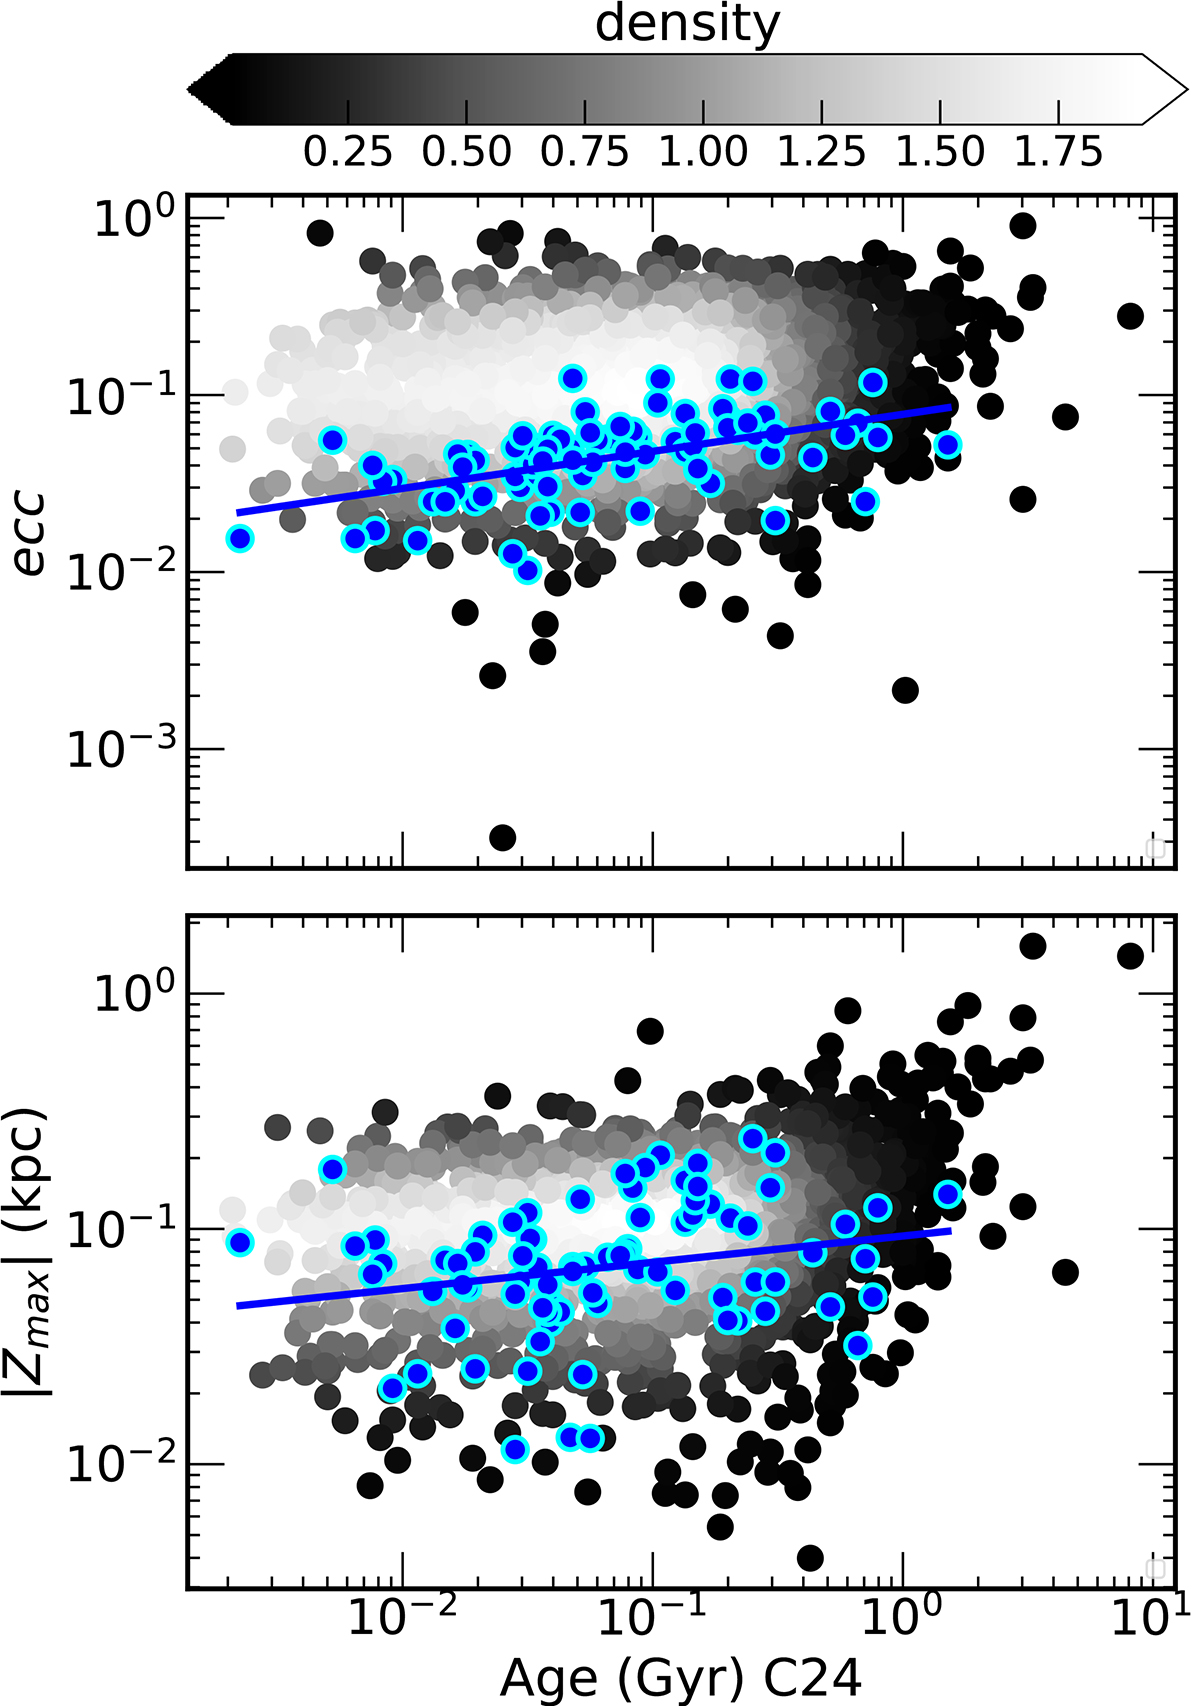
Age C24 (Gyr) vs. ecc and |Zmax| (kpc) for our sample of ∼1500 clusters colored using a point density function. The blue points correspond to the benchmark sample located at distances < 217 pc, and the solid blue line with its corresponding linear fit.
Current usage metrics show cumulative count of Article Views (full-text article views including HTML views, PDF and ePub downloads, according to the available data) and Abstracts Views on Vision4Press platform.
Data correspond to usage on the plateform after 2015. The current usage metrics is available 48-96 hours after online publication and is updated daily on week days.
Initial download of the metrics may take a while.