Fig. 6.
Download original image
![]() ,
, ![]() and
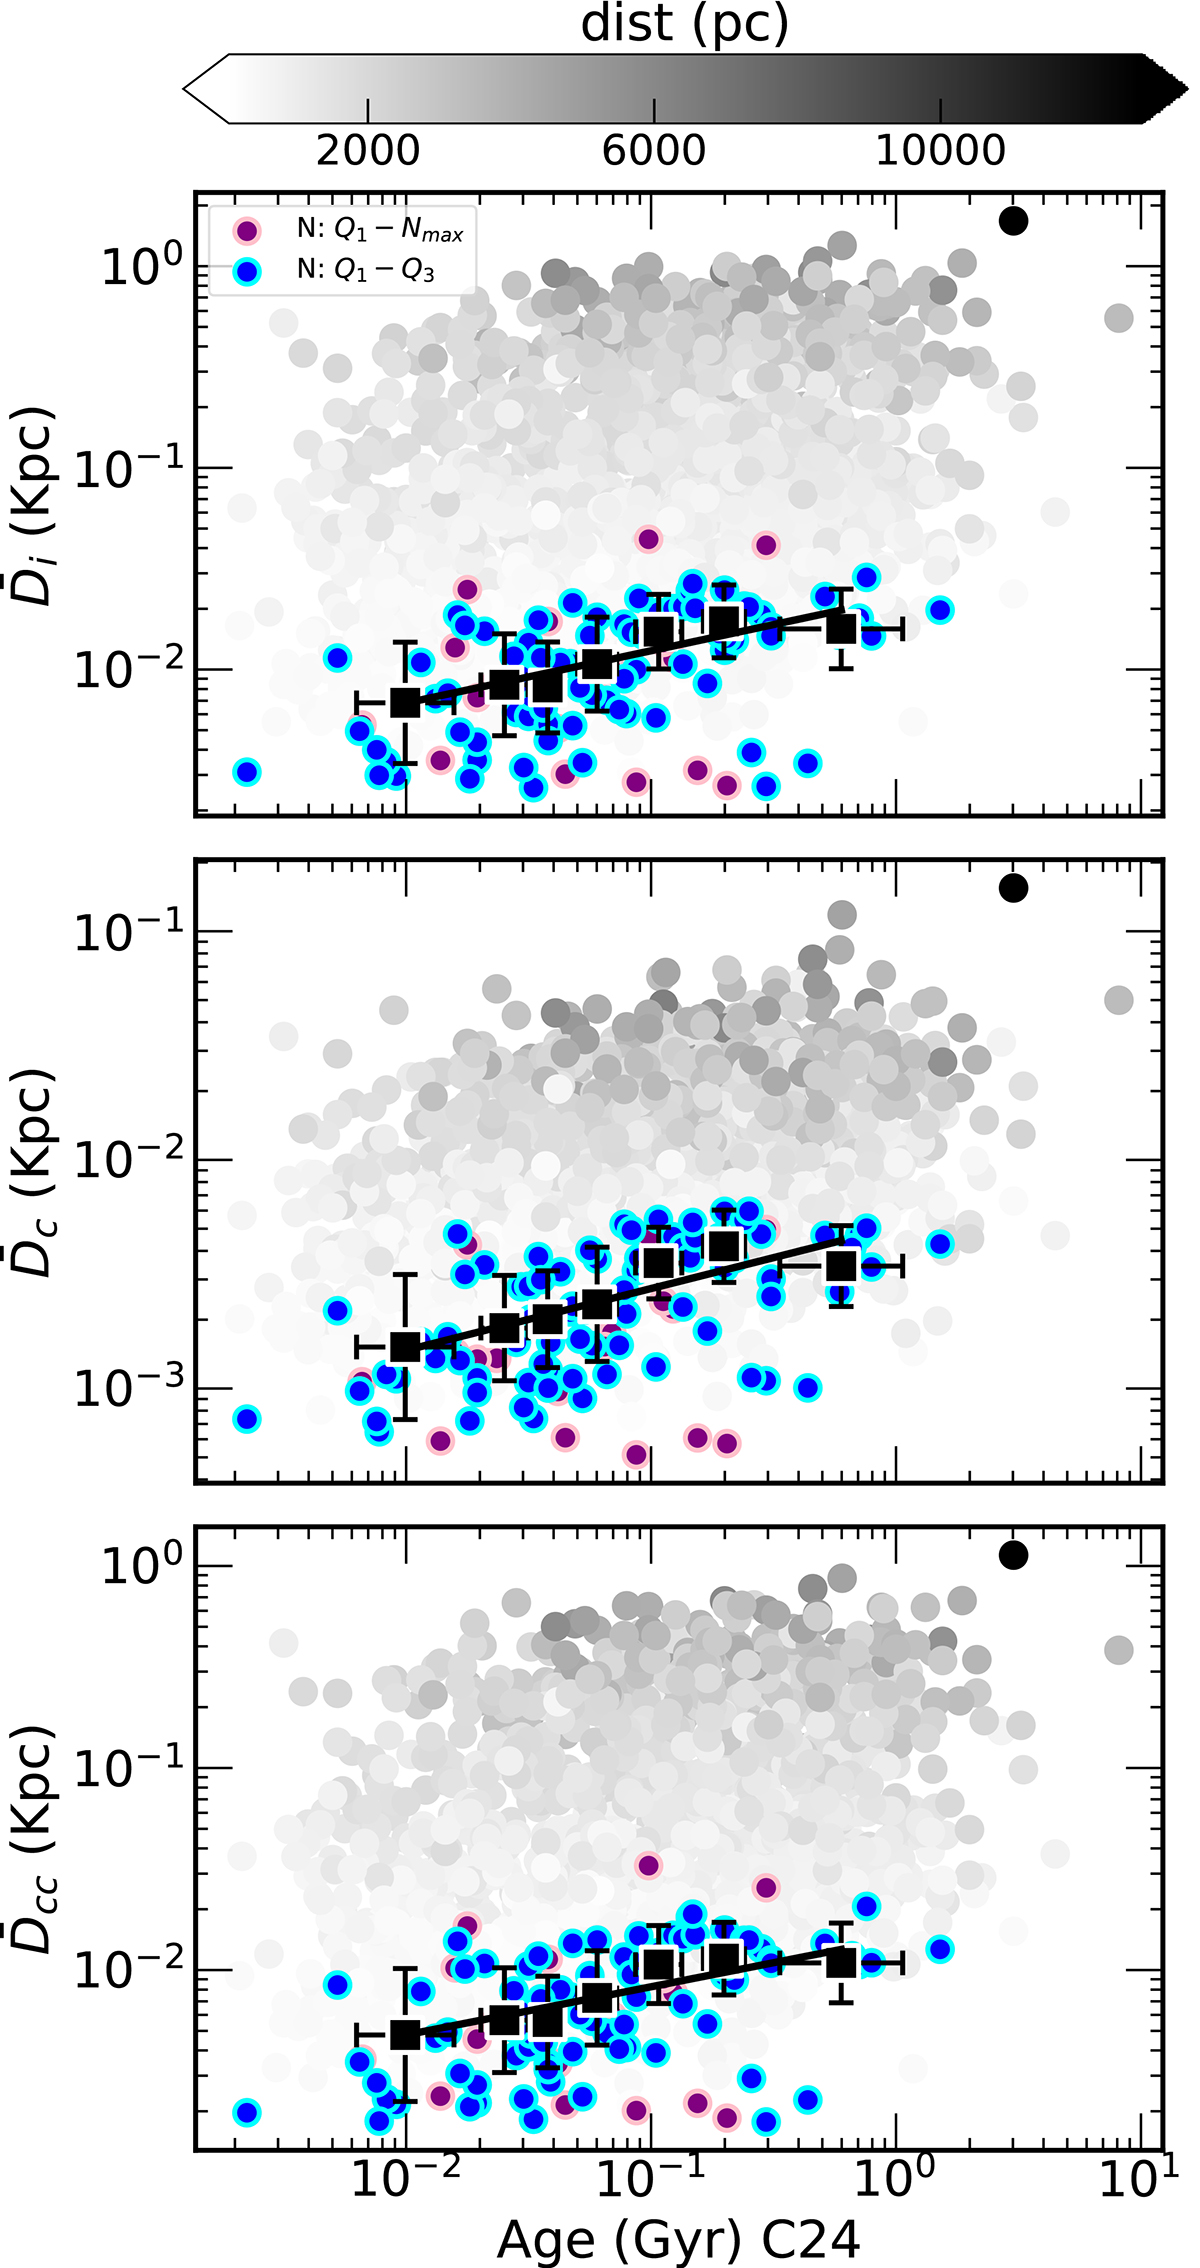
and ![]() (kpc) vs. Age (Gyr) on a logarithmic scale for a subsample of 81 open clusters (blue) at a distance < 217 pc. The clusters are also shown in 7 equally distributed bins (black colour). In the background (light gray), the our sample of ∼1500 clusters in the solar region. The black lines show the linear fit on a logarithmic scale to the clusters’ data. The most populated open clusters at a distance < 217 pc are shown in purple.
(kpc) vs. Age (Gyr) on a logarithmic scale for a subsample of 81 open clusters (blue) at a distance < 217 pc. The clusters are also shown in 7 equally distributed bins (black colour). In the background (light gray), the our sample of ∼1500 clusters in the solar region. The black lines show the linear fit on a logarithmic scale to the clusters’ data. The most populated open clusters at a distance < 217 pc are shown in purple.
Current usage metrics show cumulative count of Article Views (full-text article views including HTML views, PDF and ePub downloads, according to the available data) and Abstracts Views on Vision4Press platform.
Data correspond to usage on the plateform after 2015. The current usage metrics is available 48-96 hours after online publication and is updated daily on week days.
Initial download of the metrics may take a while.