Open Access
Fig. 5.
Download original image
![]() ,
, ![]() and
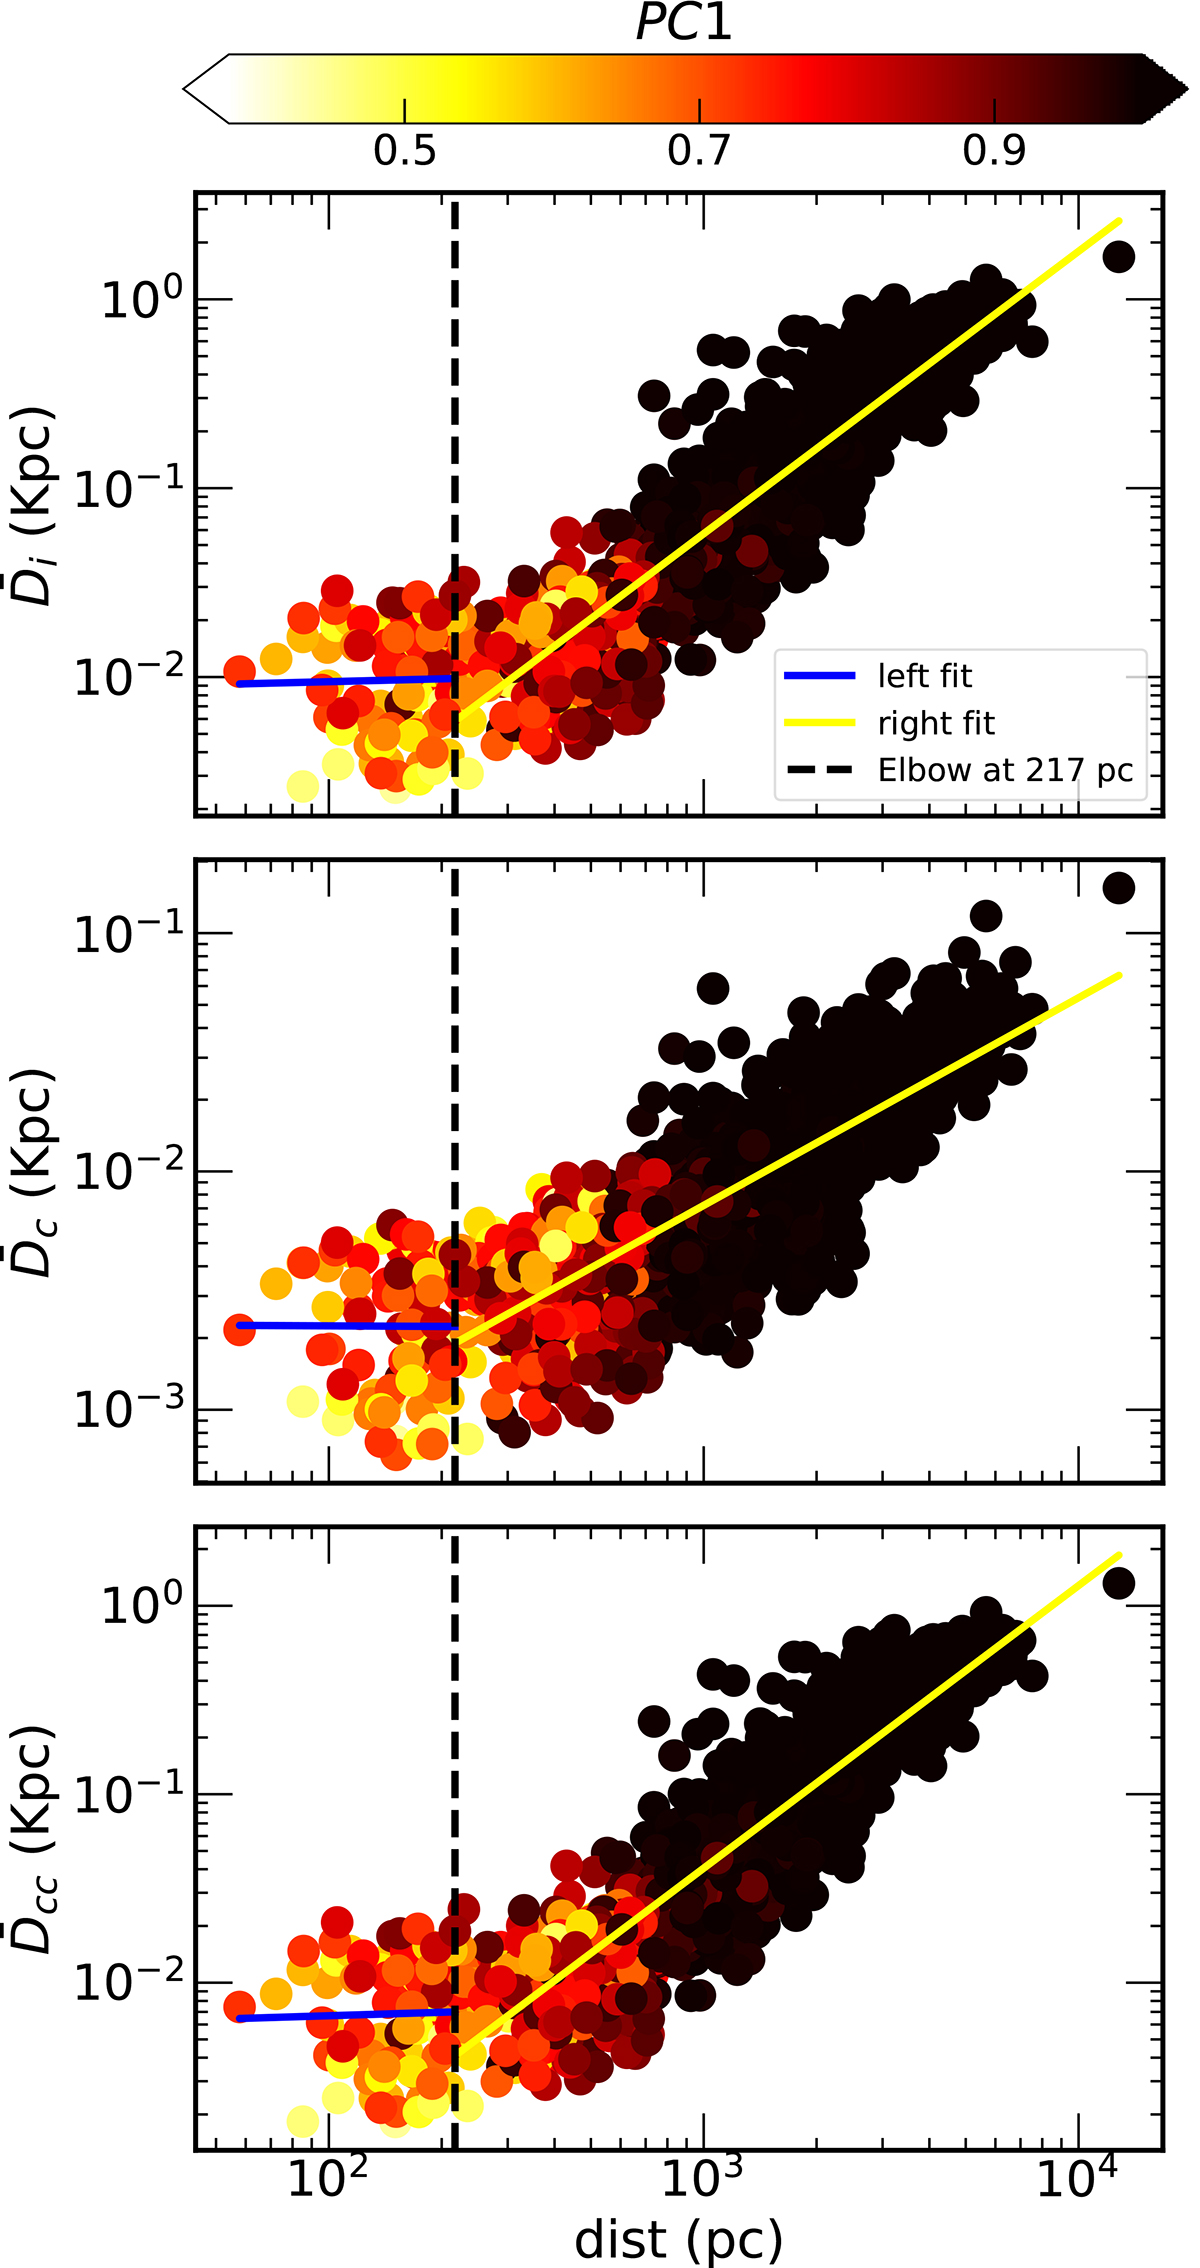
and ![]() (kpc) vs. distance for our sample of ∼1500 open clusters color-coded by their PC1 value. The black dashed vertical line represents the slope change location. The solid yellow and blue lines are a linear fit to the data at both intervals of slope change point.
(kpc) vs. distance for our sample of ∼1500 open clusters color-coded by their PC1 value. The black dashed vertical line represents the slope change location. The solid yellow and blue lines are a linear fit to the data at both intervals of slope change point.
Current usage metrics show cumulative count of Article Views (full-text article views including HTML views, PDF and ePub downloads, according to the available data) and Abstracts Views on Vision4Press platform.
Data correspond to usage on the plateform after 2015. The current usage metrics is available 48-96 hours after online publication and is updated daily on week days.
Initial download of the metrics may take a while.