Open Access
Fig. 9
Download original image
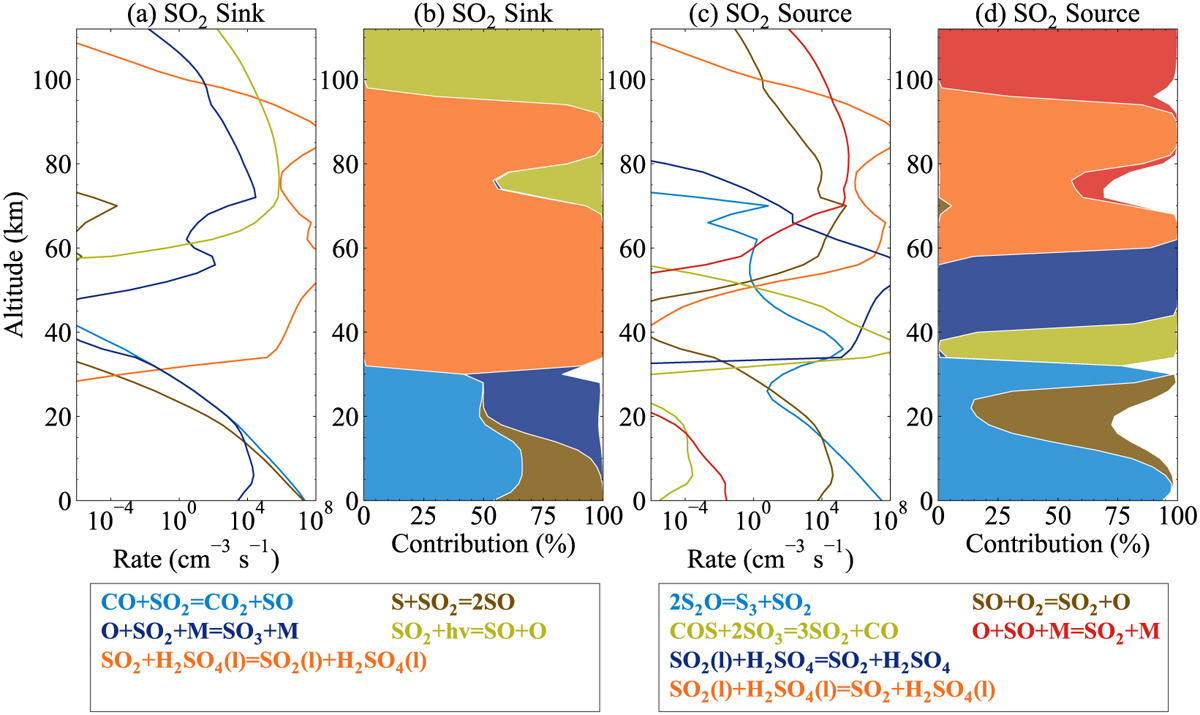
Two left panels show the reaction rates (a) and their contributions (b) to the chemical sink of SO2 in the nominal model. The two right panels show the rates (c) and contributions (d) to the chemical source in the nominal model. Only reactions with a maximum contribution (over altitude) larger than 0.3 are presented.
Current usage metrics show cumulative count of Article Views (full-text article views including HTML views, PDF and ePub downloads, according to the available data) and Abstracts Views on Vision4Press platform.
Data correspond to usage on the plateform after 2015. The current usage metrics is available 48-96 hours after online publication and is updated daily on week days.
Initial download of the metrics may take a while.