Fig. 7.
Download original image
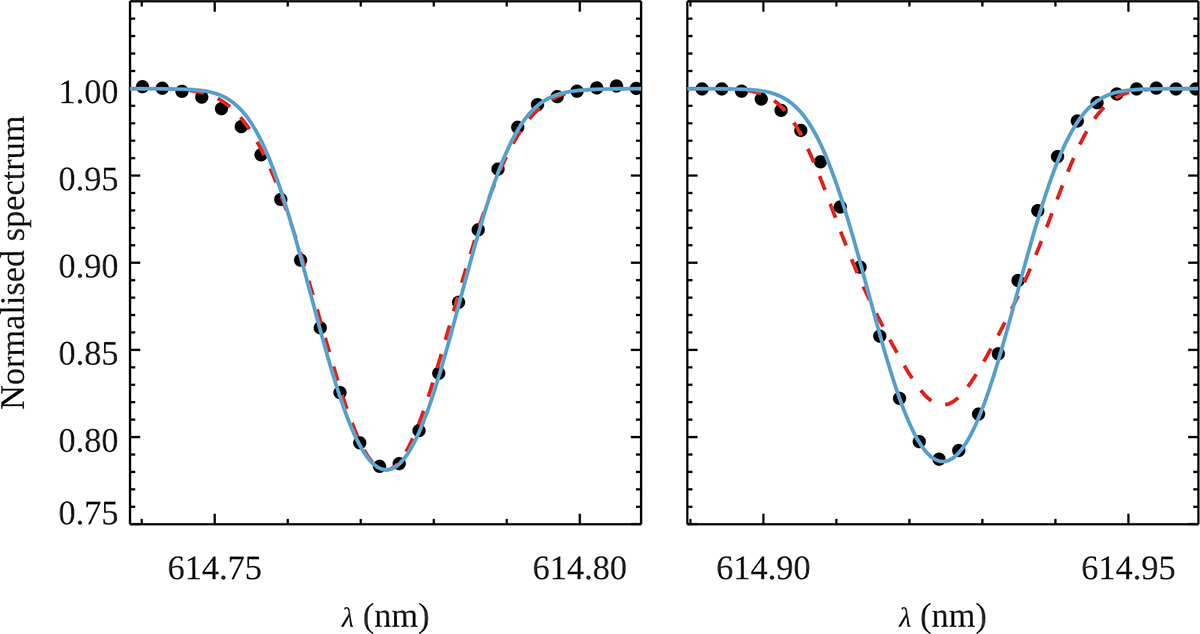
Observed (symbols, Takeda 2023) and calculated (curves) profiles of the Fe II 614.7 and 614.9 nm lines. The solid line shows the calculation with the Fe II oscillator strengths from Raassen & Uylings (1998), blending by the Fe I 614.8 nm line, and no magnetic field. The dashed line corresponds to the synthetic spectrum computed with the oscillator strengths from Kurucz (2013), with no Fe I blending, and B = 2.7 kG.
Current usage metrics show cumulative count of Article Views (full-text article views including HTML views, PDF and ePub downloads, according to the available data) and Abstracts Views on Vision4Press platform.
Data correspond to usage on the plateform after 2015. The current usage metrics is available 48-96 hours after online publication and is updated daily on week days.
Initial download of the metrics may take a while.