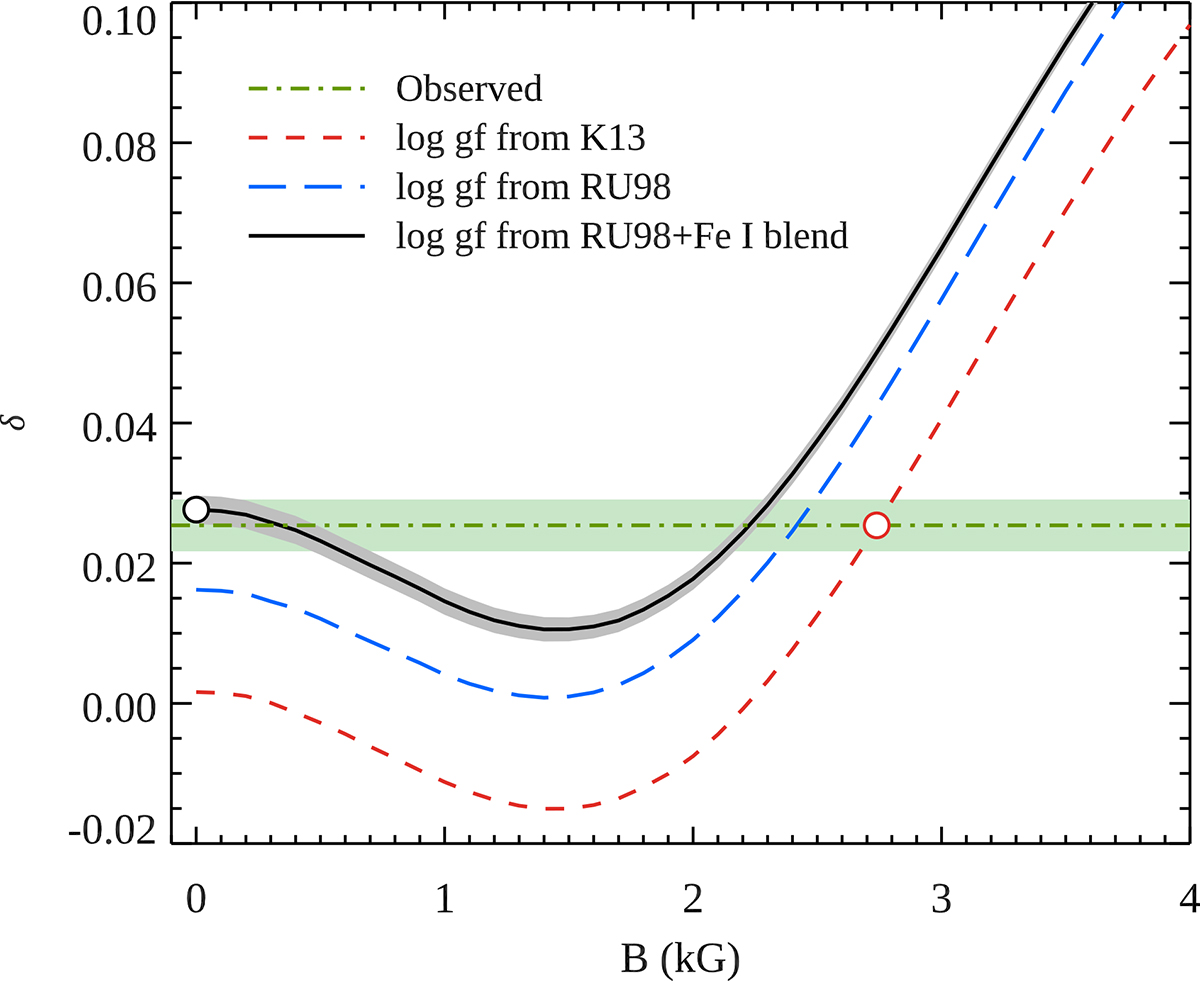
Fig. 6.
Download original image
Relative intensification of the Fe II 614.77 and 614.92 nm line pair as a function of magnetic field strength (solid line with the underlying grey curve illustrating ±1σ uncertainty arising from the oscillator strength of the Fe I 614.8 nm blend). The horizontal dash-dotted line corresponds to the observed intensification value with the ±1σ uncertainty indicated by the green rectangle. The long- and short-dashed lines show theoretical intensification curves for different choices of Fe II oscillator strength (K13: Kurucz 2013, RU98: Raassen & Uylings 1998) and blending. The two open circles indicate the line parameter-field strength combinations adopted for the synthetic calculations shown in Fig. 7.
Current usage metrics show cumulative count of Article Views (full-text article views including HTML views, PDF and ePub downloads, according to the available data) and Abstracts Views on Vision4Press platform.
Data correspond to usage on the plateform after 2015. The current usage metrics is available 48-96 hours after online publication and is updated daily on week days.
Initial download of the metrics may take a while.