Open Access
Fig. 5.
Download original image
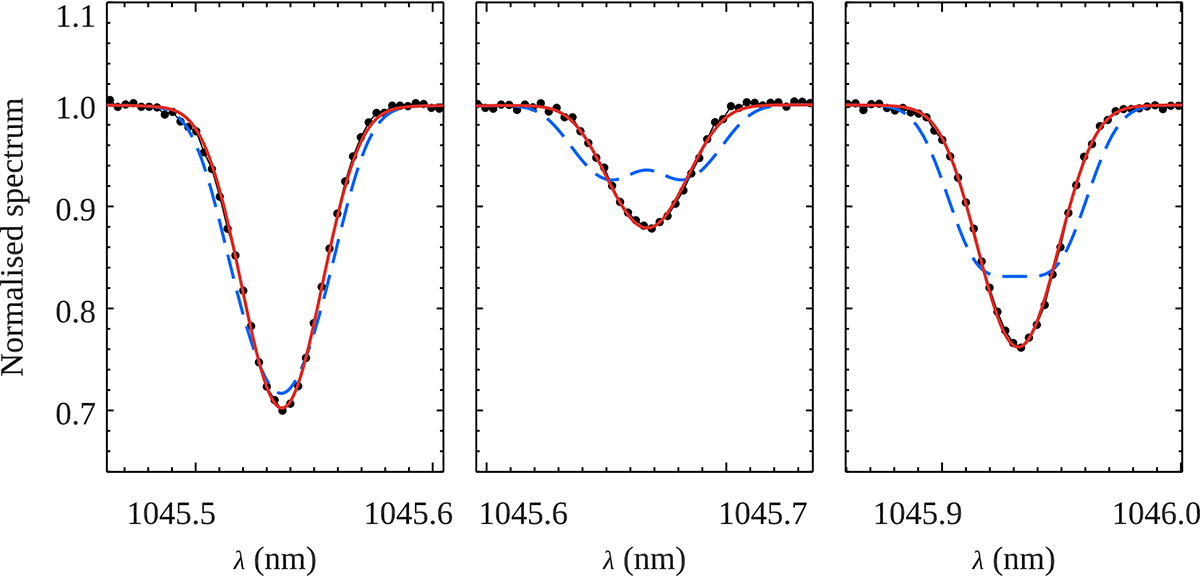
Comparison of the S I lines in the CRIRES+ observation of o Peg (symbols) with the best-fitting non-magnetic model spectrum (solid lines). The dashed lines show an attempt at fitting the data assuming a 2 kG magnetic field.
Current usage metrics show cumulative count of Article Views (full-text article views including HTML views, PDF and ePub downloads, according to the available data) and Abstracts Views on Vision4Press platform.
Data correspond to usage on the plateform after 2015. The current usage metrics is available 48-96 hours after online publication and is updated daily on week days.
Initial download of the metrics may take a while.