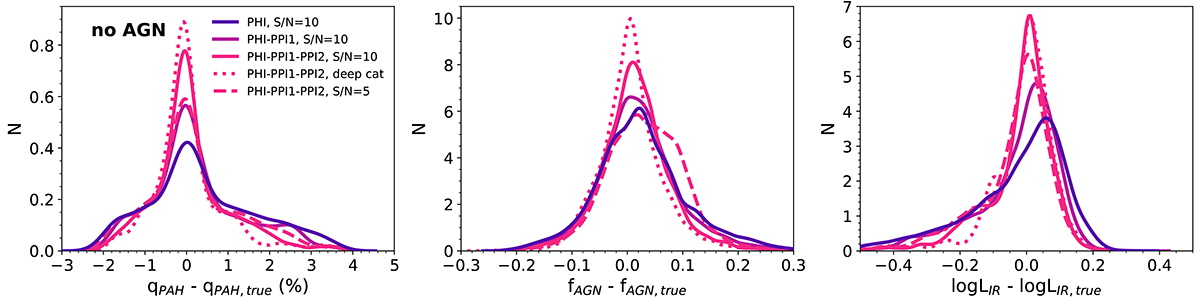
Fig. 9.
Download original image
Normalised distributions of the difference between the estimated and the true values of the extracted parameters. In each panel, the lines are colour coded according to the set of filters used in the fitting. The distributions include all models whose parameters are described in Table 2. The same distributions, with the PHI+PPI1+PPI2 set of filters but assuming a S/N of 5 instead of 10 in PHI1_4 are shown with a dashed line. The dotted line shows the results using the confusion noise for the deep catalogue from Donnellan et al. (2024), attainable in regions where ancillary information exists (e.g. from the Roman Space Telescope). Left panel: PAH fraction measured in percent (qPAH). Centre panel: AGN fractional contribution to the total IR luminosity (fAGN). Right panel: Total IR luminosity (log LIR). The distributions do not show any bias for the estimate of the PAH fraction and the AGN fraction at z = 1 and z = 2. The log LIR estimated with only the PHI presents a bias of +0.07 dex and a tail toward larger underestimates (factors of 2 to 3). Dropping the required S/N from 10 to 5 in the PHI1_4 has only a very modest impact on qPAH and fAGN and does not introduce any bias.
Current usage metrics show cumulative count of Article Views (full-text article views including HTML views, PDF and ePub downloads, according to the available data) and Abstracts Views on Vision4Press platform.
Data correspond to usage on the plateform after 2015. The current usage metrics is available 48-96 hours after online publication and is updated daily on week days.
Initial download of the metrics may take a while.