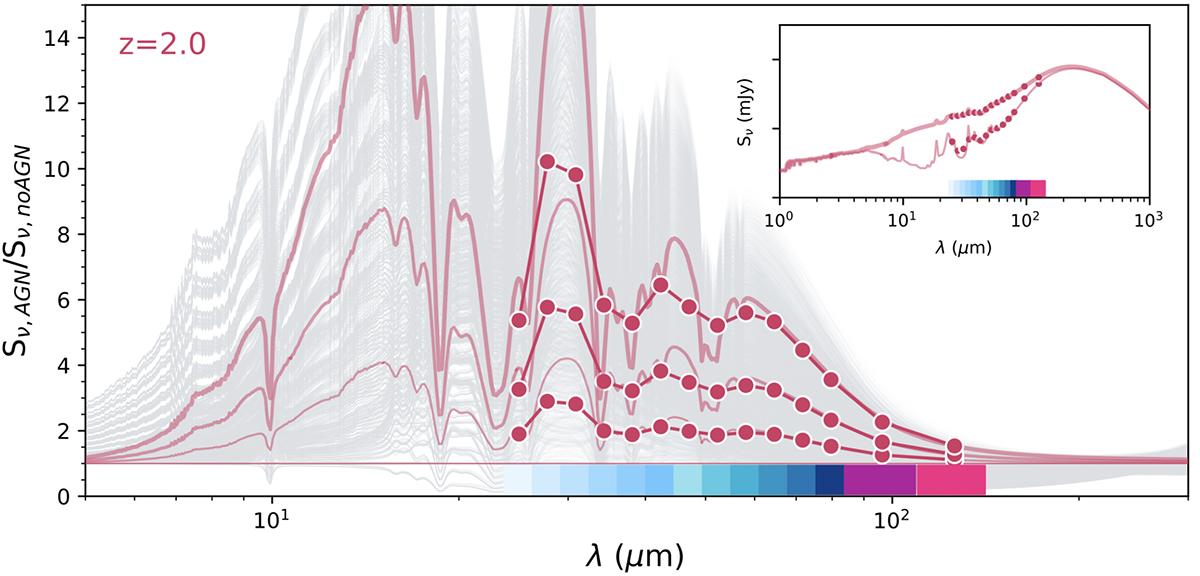
Fig. 8.
Download original image
Contribution of AGN emission to the PRIMAger bandpass. Thin grey lines show a z = 2 galaxy SED including different AGN properties (see Table 2), divided by the SED without an AGN component. As an example, the emission of one AGN model with different fAGN contributions (15, 30, and 45% of the total IR luminosity) is shown in red thick lines. The fluxes obtained for integration in the equivalent filters with centre wavelengths listed in Table 1 for PHI+PPI1+PPI2 are shown as red circles. The inset panel shows the SEDs corresponding to the red lines (for fAGN = 0% and fAGN = 45%) over the full UV to submm wavelength range. The PRIMAger bands are well suited to probing the impact of AGN emission on the IR SED of galaxies.
Current usage metrics show cumulative count of Article Views (full-text article views including HTML views, PDF and ePub downloads, according to the available data) and Abstracts Views on Vision4Press platform.
Data correspond to usage on the plateform after 2015. The current usage metrics is available 48-96 hours after online publication and is updated daily on week days.
Initial download of the metrics may take a while.