Fig. 5.
Download original image
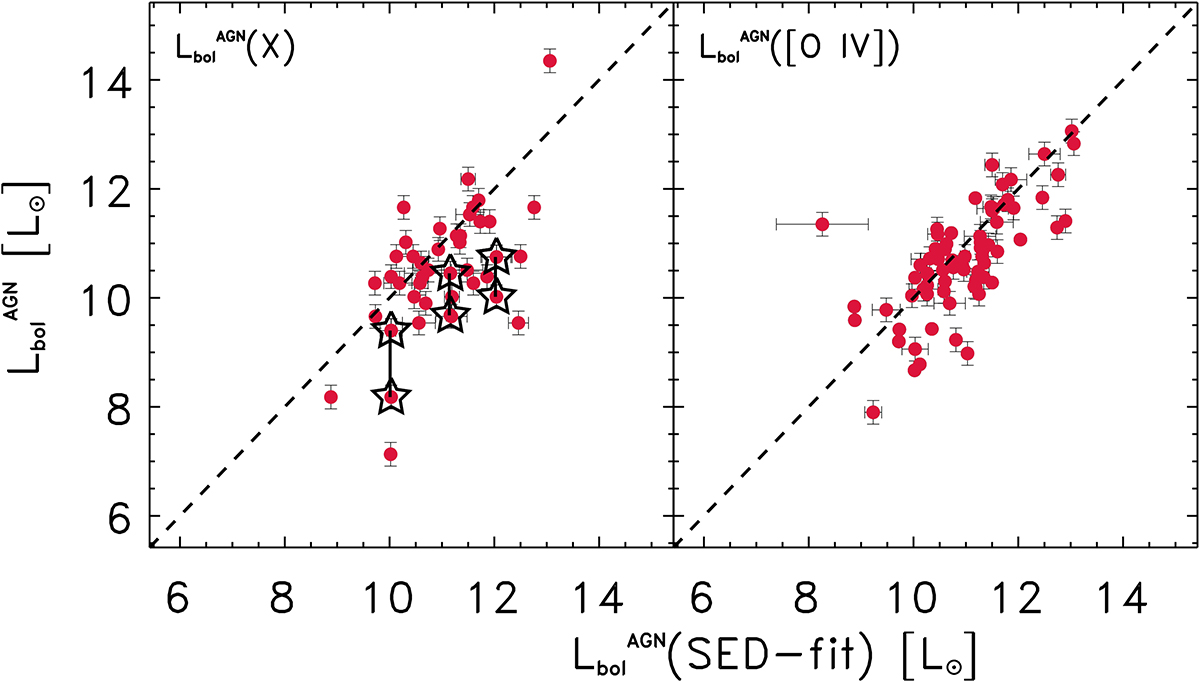
Power of SED decomposition to derive the AGN bolometric luminosity (![]() ), and the BHAR. The panels show the AGN bolometric luminosity derived from SED fitting by Gruppioni et al. (2016) for a local sample of AGN versus the AGN bolometric luminosity derived from different indicators: Left: X-ray (2−10 keV) luminosity. Right: [O IV] 25.9 μm FIR line. X-ray bolometric corrections are taken from Brightman & Nandra (2011). The dashed line represents the 1−1 relation. With PRIMA we will be able to perform similar decompositions up to z = 2. The stars in the left panel show how the X-ray-derived
), and the BHAR. The panels show the AGN bolometric luminosity derived from SED fitting by Gruppioni et al. (2016) for a local sample of AGN versus the AGN bolometric luminosity derived from different indicators: Left: X-ray (2−10 keV) luminosity. Right: [O IV] 25.9 μm FIR line. X-ray bolometric corrections are taken from Brightman & Nandra (2011). The dashed line represents the 1−1 relation. With PRIMA we will be able to perform similar decompositions up to z = 2. The stars in the left panel show how the X-ray-derived ![]() increases for Compton-thick AGN once the hard X-ray spectrum is included (as shown by La Caria et al. 2019). The correlation found in the right panel can be used as a calibration for the SED-fitting results when FIR spectroscopy is not available.
increases for Compton-thick AGN once the hard X-ray spectrum is included (as shown by La Caria et al. 2019). The correlation found in the right panel can be used as a calibration for the SED-fitting results when FIR spectroscopy is not available.
Current usage metrics show cumulative count of Article Views (full-text article views including HTML views, PDF and ePub downloads, according to the available data) and Abstracts Views on Vision4Press platform.
Data correspond to usage on the plateform after 2015. The current usage metrics is available 48-96 hours after online publication and is updated daily on week days.
Initial download of the metrics may take a while.