Fig. 3.
Download original image
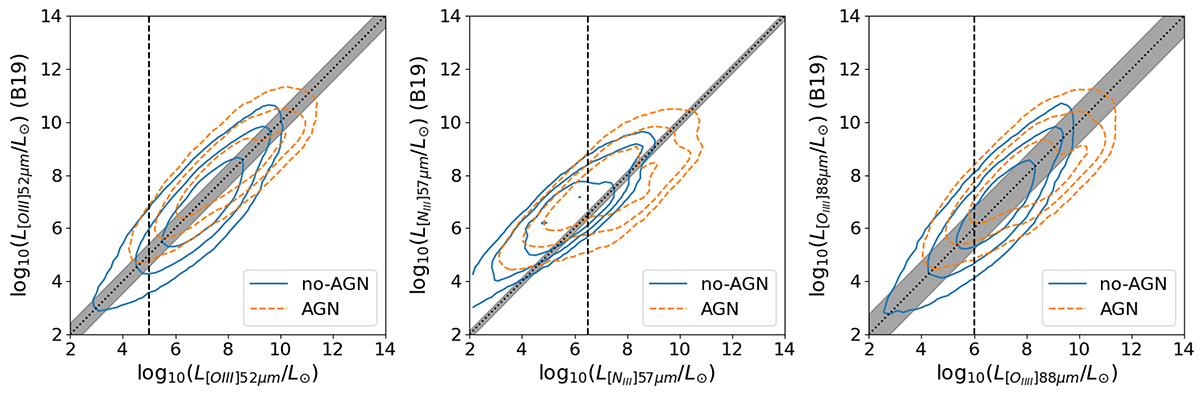
Metallicity-dependent method outlined in Sect. 2.2.1. This method provides luminosity estimates consistent with those derived using the empirical relations by Bonato et al. (2019). In the figure we show the comparison for the [O III]52 μm (left), [N III]57 μm (centre), and [O III]88 μm (right) lines. Dotted lines indicate a 1:1 relation, with the shaded region showing the 1σ of the relations by Bonato et al. (2019). The vertical dashed lines show the minimum line luminosity used in the relation by Bonato et al. (2019). Contours correspond to 68%, 95%, and 99.7% of the distribution of objects hosting an AGN (orange dashed contours) and non-active galaxies (solid blue contours).
Current usage metrics show cumulative count of Article Views (full-text article views including HTML views, PDF and ePub downloads, according to the available data) and Abstracts Views on Vision4Press platform.
Data correspond to usage on the plateform after 2015. The current usage metrics is available 48-96 hours after online publication and is updated daily on week days.
Initial download of the metrics may take a while.