Fig. 16.
Download original image
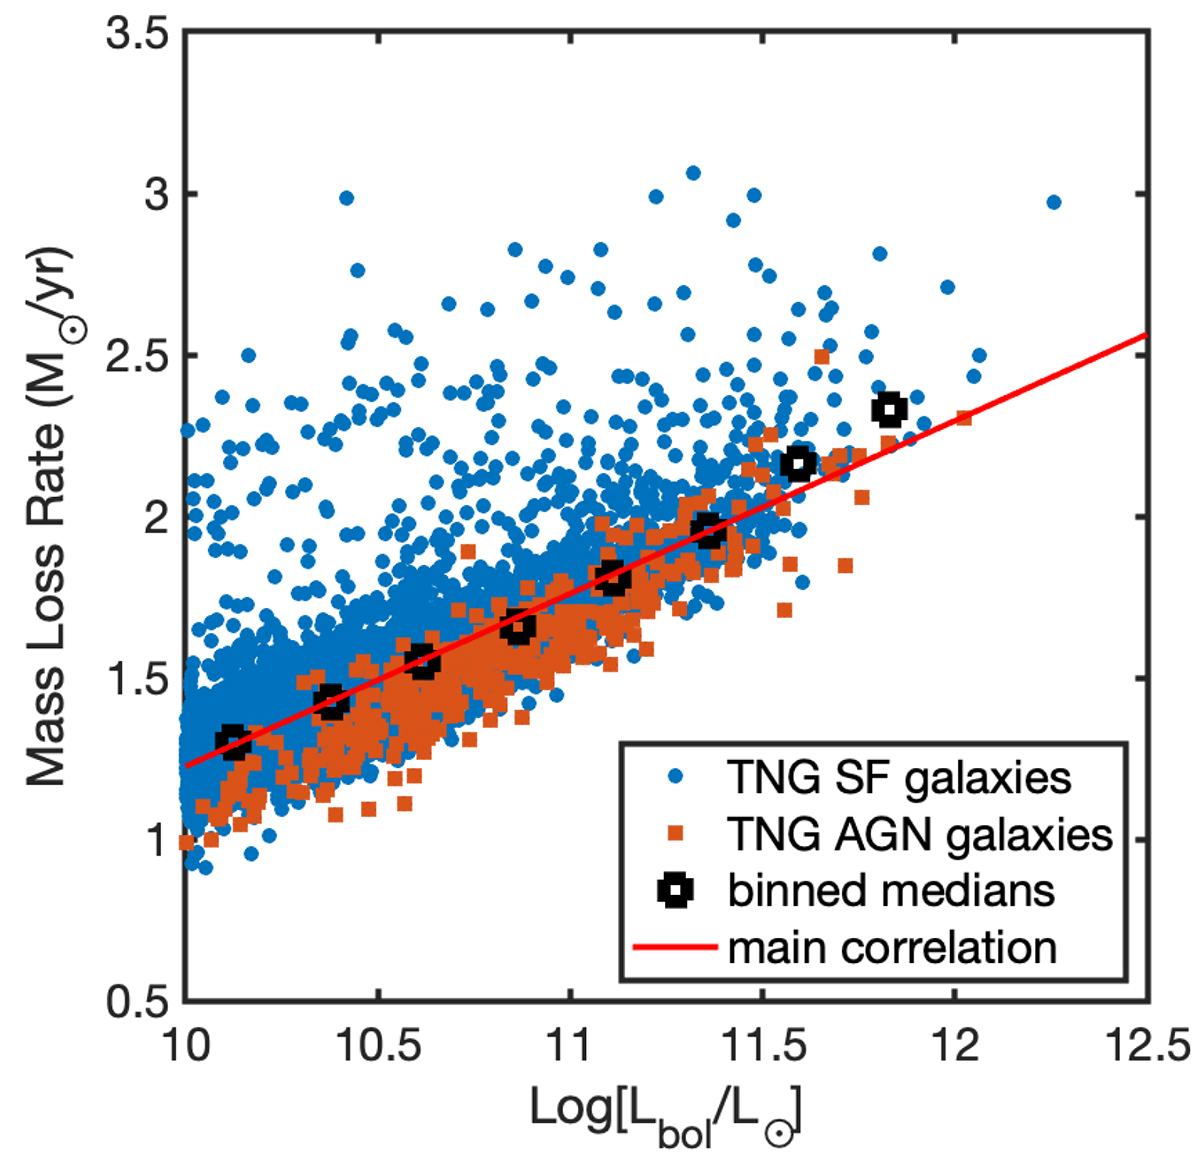
Correlation between bolometric luminosity and outflow mass-loss rate in IllustrisTNG simulations. Red square symbols represent galaxies where the AGN has ≥20% contribution to Lbol, while blue symbols are all other galaxies. The median mass-loss rate in bins of Lbol is shown by the black symbols. The main correlation, log(Ṁoutf) = 0.54 log(Lbol) − 4.13, is shown by the red line.
Current usage metrics show cumulative count of Article Views (full-text article views including HTML views, PDF and ePub downloads, according to the available data) and Abstracts Views on Vision4Press platform.
Data correspond to usage on the plateform after 2015. The current usage metrics is available 48-96 hours after online publication and is updated daily on week days.
Initial download of the metrics may take a while.