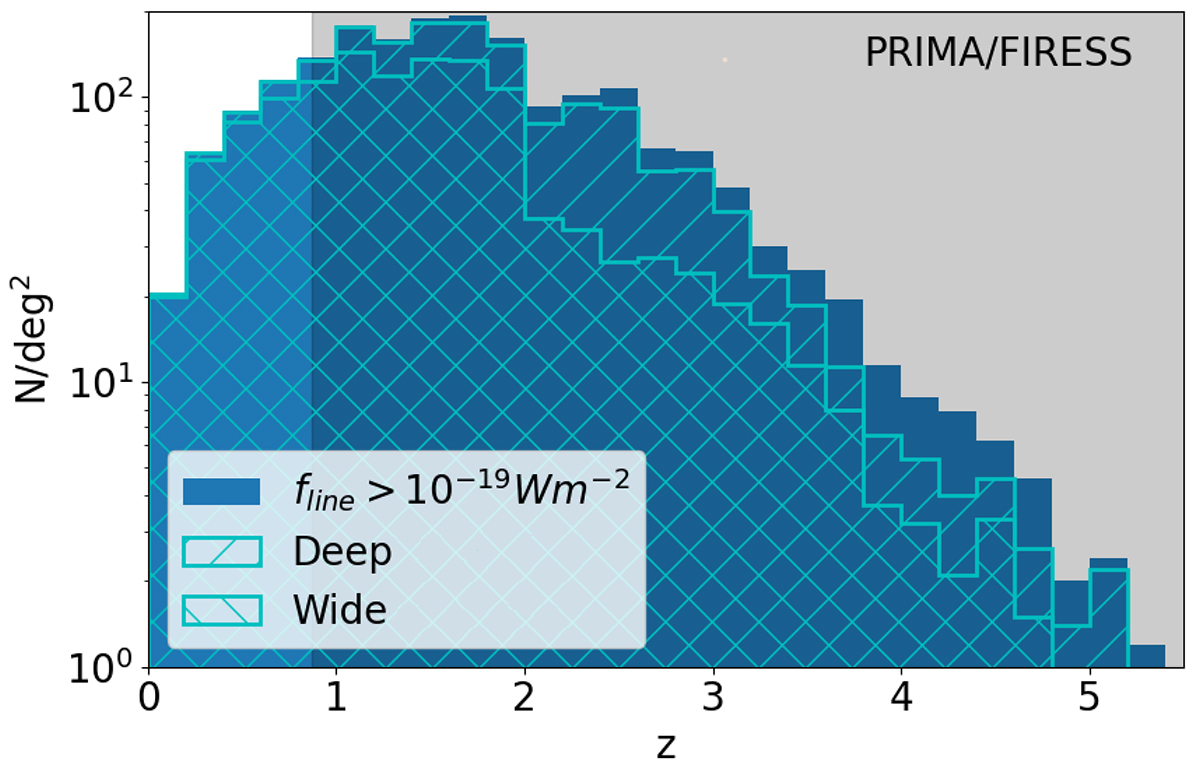
Fig. 14.
Download original image
Redshift distribution of line-detected galaxies. The photometric survey can be used to identify galaxies to follow-up in spectroscopy. We show the redshift distribution of galaxies with [O IV]26 μm and [Ne II]13 μm lines above 10−19 W/m2 (blue histogram) with the subsamples detected in the Deep and Wide surveys (hatched histograms), considering the conservative depths. The grey area shows the redshift range in which [O IV]26 μm and [Ne II]13 μm lines are in the PRIMA/FIRESS wavelength coverage, but other lines can be used at z < 0.8 to derive SFR and BHAR.
Current usage metrics show cumulative count of Article Views (full-text article views including HTML views, PDF and ePub downloads, according to the available data) and Abstracts Views on Vision4Press platform.
Data correspond to usage on the plateform after 2015. The current usage metrics is available 48-96 hours after online publication and is updated daily on week days.
Initial download of the metrics may take a while.