Fig. 13.
Download original image
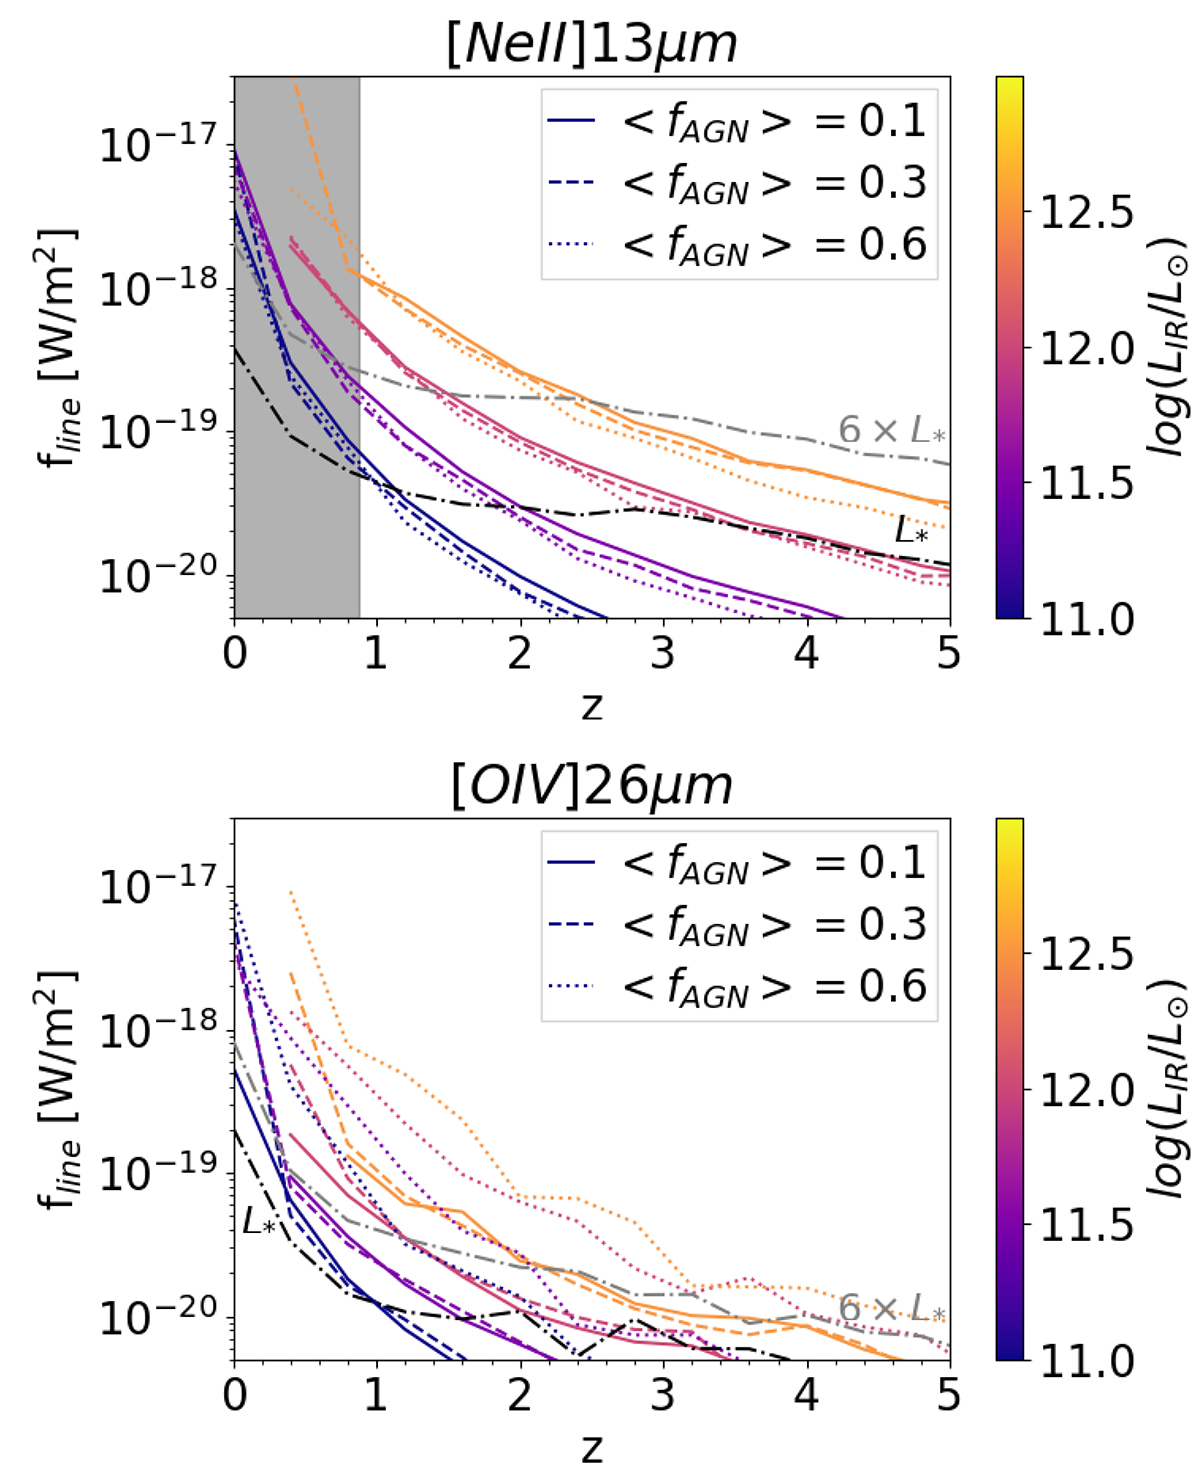
Evolution of line fluxes with redshift, IR luminosity and AGN fraction. Spectroscopic follow-up analyses of galaxies down to 10−19 W/m2 will start probing more normal galaxies and not only ultraluminous IR galaxies. We show the [Ne II]13 μm (top) and [O IV]26 μm (bottom) line fluxes as a function of redshift, total IR luminosity (see colour bar), and IR-AGN fraction (different line styles in bins with ΔfAGN = 0.2). Dashed dotted lines indicate the line fluxes for galaxies in the knee of the IR luminosity function and six times above it (Traina et al. 2024). The grey area in the top panel shows the redshift range in which the [Ne II]13 μm line is not in the PRIMA/FIRESS wavelength coverage.
Current usage metrics show cumulative count of Article Views (full-text article views including HTML views, PDF and ePub downloads, according to the available data) and Abstracts Views on Vision4Press platform.
Data correspond to usage on the plateform after 2015. The current usage metrics is available 48-96 hours after online publication and is updated daily on week days.
Initial download of the metrics may take a while.