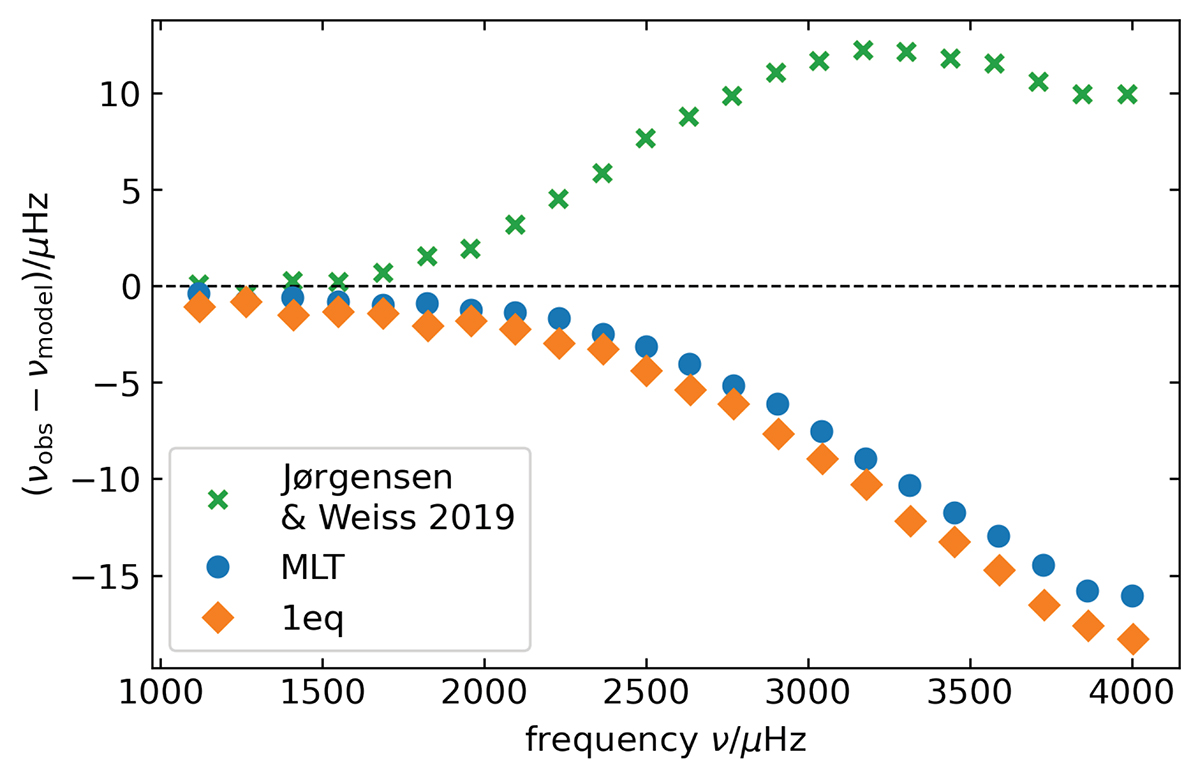
Fig. A.1.
Download original image
The difference between the observed frequencies of the l = 0 modes (Broomhall et al. 2009; Davies et al. 2014), and the frequencies calculated based on the SSM-K1 (orange diamonds), SSM-MLT (blue circles), and the solar model from Jørgensen & Weiss (2019), with inclusion of turbulent pressure and patched 3D atmosphere (green crosses) is shown. For the solar model from Jørgensen & Weiss (2019), the structural surface effect is corrected, and the difference between observed and calculated frequencies can be explained by remaining modal effects.
Current usage metrics show cumulative count of Article Views (full-text article views including HTML views, PDF and ePub downloads, according to the available data) and Abstracts Views on Vision4Press platform.
Data correspond to usage on the plateform after 2015. The current usage metrics is available 48-96 hours after online publication and is updated daily on week days.
Initial download of the metrics may take a while.