Fig. 6.
Download original image
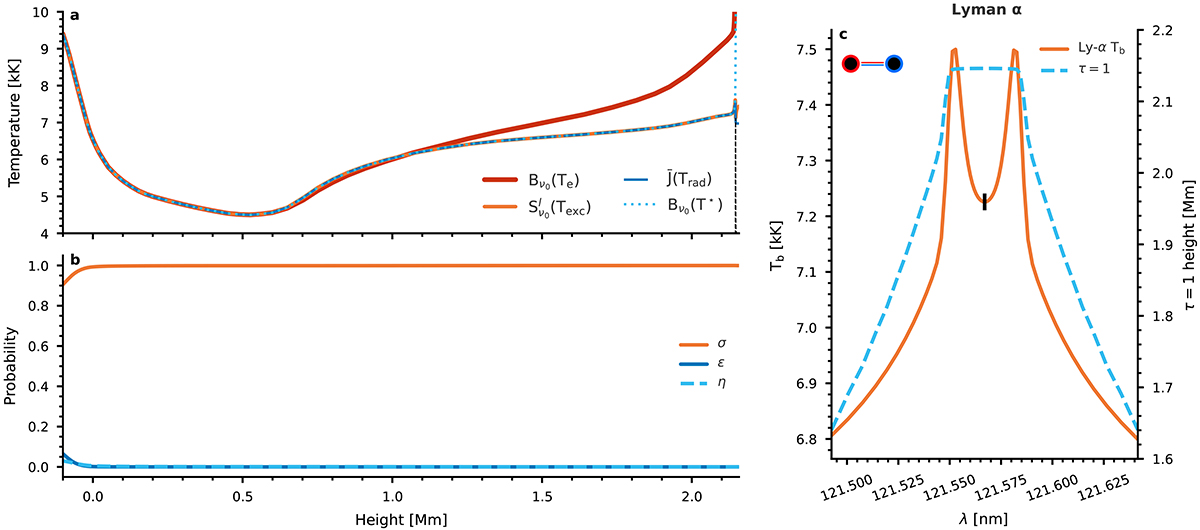
Multi-level source function description of the Ly-α spectral line synthesized from the FALC atmosphere. Panel (a) shows the computed Ly-α source function from RH (![]() ) as well as the three components describing the multi-level source function, the Planck function Bν0(Te), the mean radiation field
) as well as the three components describing the multi-level source function, the Planck function Bν0(Te), the mean radiation field ![]() , and the interlocking source function Bν0(T⋆) in units of brightness temperature. The black dashed line (top of the atmosphere) shows the normalized contribution function to intensity for the wavelength position indicated with a black vertical in Panel (c). Panel (b) illustrates the scattering probability σ, destruction probability ϵ, and interlocking probability η. Panel (c) shows the emergent line profile in units of brightness temperature as well as the optical depth unity height with the axis to the right. The icon in the top left corner indicates that two-level processes dominate the Ly-α source function.
, and the interlocking source function Bν0(T⋆) in units of brightness temperature. The black dashed line (top of the atmosphere) shows the normalized contribution function to intensity for the wavelength position indicated with a black vertical in Panel (c). Panel (b) illustrates the scattering probability σ, destruction probability ϵ, and interlocking probability η. Panel (c) shows the emergent line profile in units of brightness temperature as well as the optical depth unity height with the axis to the right. The icon in the top left corner indicates that two-level processes dominate the Ly-α source function.
Current usage metrics show cumulative count of Article Views (full-text article views including HTML views, PDF and ePub downloads, according to the available data) and Abstracts Views on Vision4Press platform.
Data correspond to usage on the plateform after 2015. The current usage metrics is available 48-96 hours after online publication and is updated daily on week days.
Initial download of the metrics may take a while.