Fig. 2.
Download original image
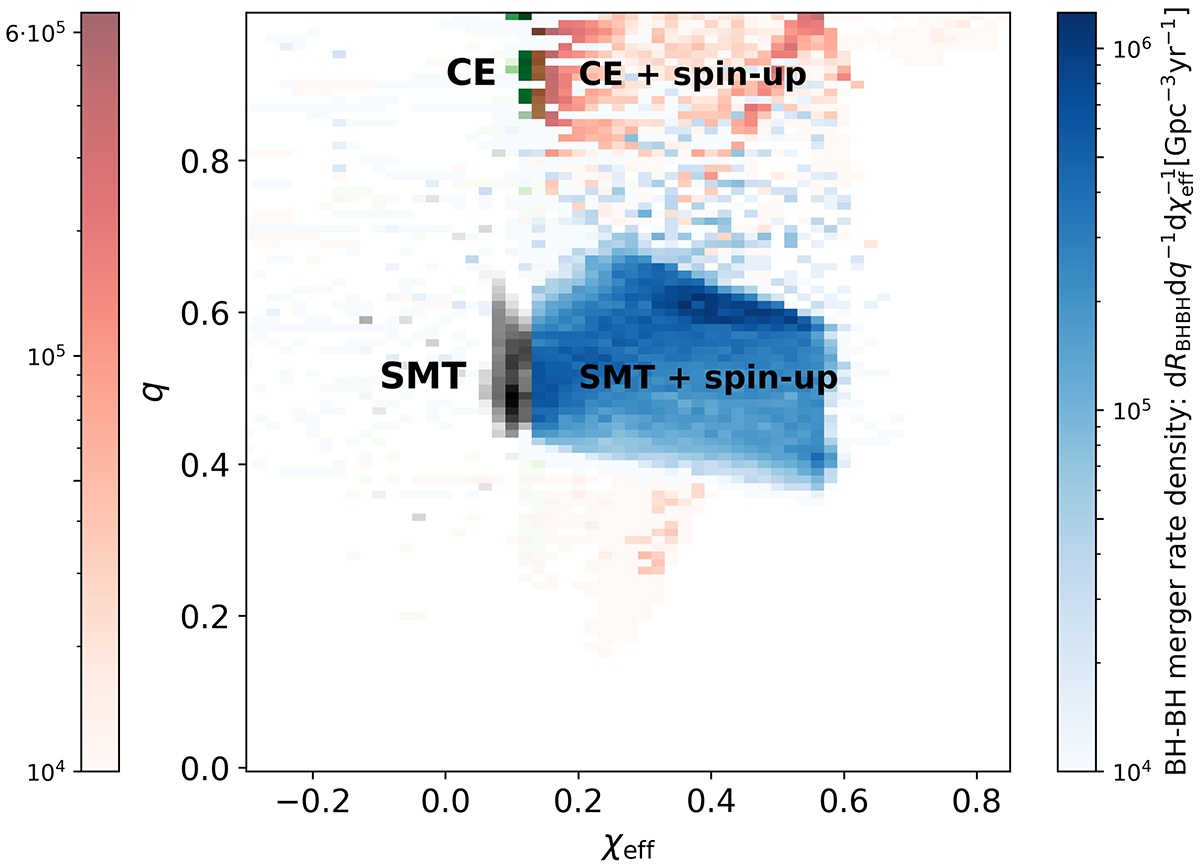
Two-dimensional χeff – q histograms of BH–BH merger rate density ![]() [Gpc−3yr−1] up to redshifts zmer < 1.0 in our default model with the revised mass transfer stability criteria (Pavlovskii et al. 2017; Olejak et al. 2021). The BH–BH mergers have been produced via SMT (black and blue colors) and CE (green and red colors) subchannels. The formation of highly spinning mergers with χeff ⪆ 0.15 was followed by a tidal spin-up phase in close BH-helium core binaries (blue and red colors).
[Gpc−3yr−1] up to redshifts zmer < 1.0 in our default model with the revised mass transfer stability criteria (Pavlovskii et al. 2017; Olejak et al. 2021). The BH–BH mergers have been produced via SMT (black and blue colors) and CE (green and red colors) subchannels. The formation of highly spinning mergers with χeff ⪆ 0.15 was followed by a tidal spin-up phase in close BH-helium core binaries (blue and red colors).
Current usage metrics show cumulative count of Article Views (full-text article views including HTML views, PDF and ePub downloads, according to the available data) and Abstracts Views on Vision4Press platform.
Data correspond to usage on the plateform after 2015. The current usage metrics is available 48-96 hours after online publication and is updated daily on week days.
Initial download of the metrics may take a while.