Fig. 7
Download original image
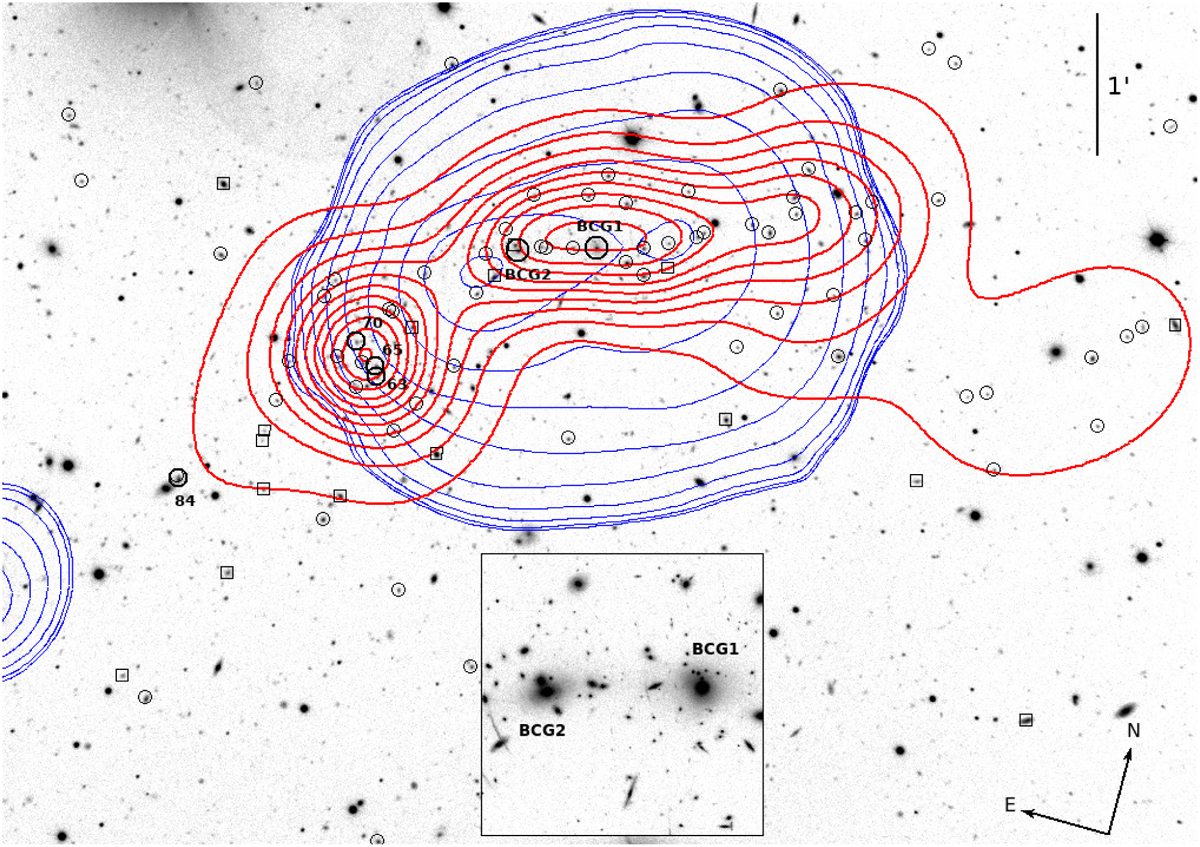
TNG r-band image of PSZ2 G282.28+49.94. Labels indicate the two brightest cluster members and other galaxies mentioned in the text. The blue lines identify the X-ray iso-contours derived from the wavelet-cleaned map shown in the top right panel of Fig. 3. The red contours represent the isodensity levels obtained with the 2D-DEDICA method applied to the sample of spectroscopic members. Black circles and boxes highlight the member and non-member galaxies, respectively. The inset box on the bottom is a zoom on the central region of the cluster highlighting BCG1 and BCG2 (HST data).
Current usage metrics show cumulative count of Article Views (full-text article views including HTML views, PDF and ePub downloads, according to the available data) and Abstracts Views on Vision4Press platform.
Data correspond to usage on the plateform after 2015. The current usage metrics is available 48-96 hours after online publication and is updated daily on week days.
Initial download of the metrics may take a while.