Fig. 4
Download original image
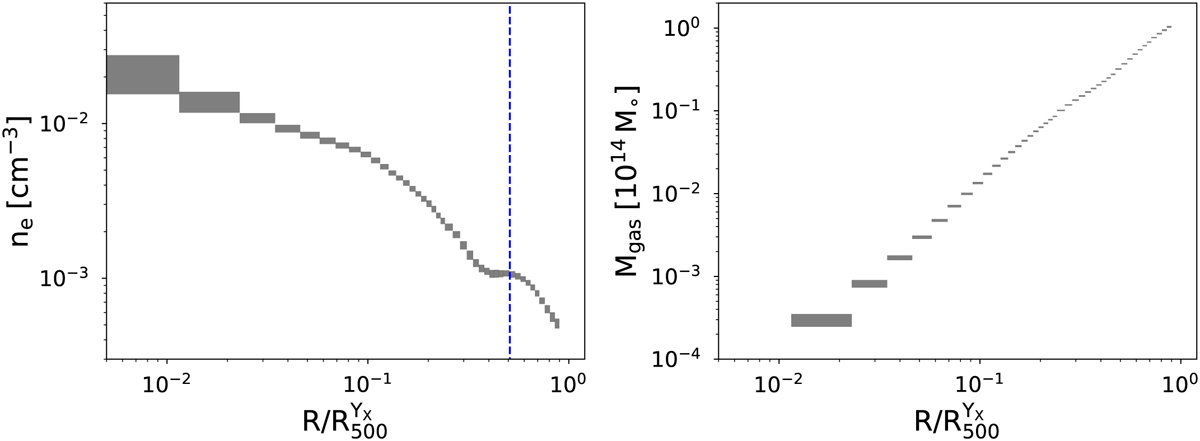
Thermodynamic radial proflies of PSZ2 G282.28+49.94 scaled by ![]() . Left panel: De-projected density profile centred on the X-ray peak. The vertical dotted blue line marks the distance between the X-ray peak and the emission of the peak of the tail to the W. Right panel: same as the left panel except for the fact that we show the gas mass profile. The width of the envelope along the у axis represents the 1σ uncertainty in both panels.
. Left panel: De-projected density profile centred on the X-ray peak. The vertical dotted blue line marks the distance between the X-ray peak and the emission of the peak of the tail to the W. Right panel: same as the left panel except for the fact that we show the gas mass profile. The width of the envelope along the у axis represents the 1σ uncertainty in both panels.
Current usage metrics show cumulative count of Article Views (full-text article views including HTML views, PDF and ePub downloads, according to the available data) and Abstracts Views on Vision4Press platform.
Data correspond to usage on the plateform after 2015. The current usage metrics is available 48-96 hours after online publication and is updated daily on week days.
Initial download of the metrics may take a while.