Fig. 3
Download original image
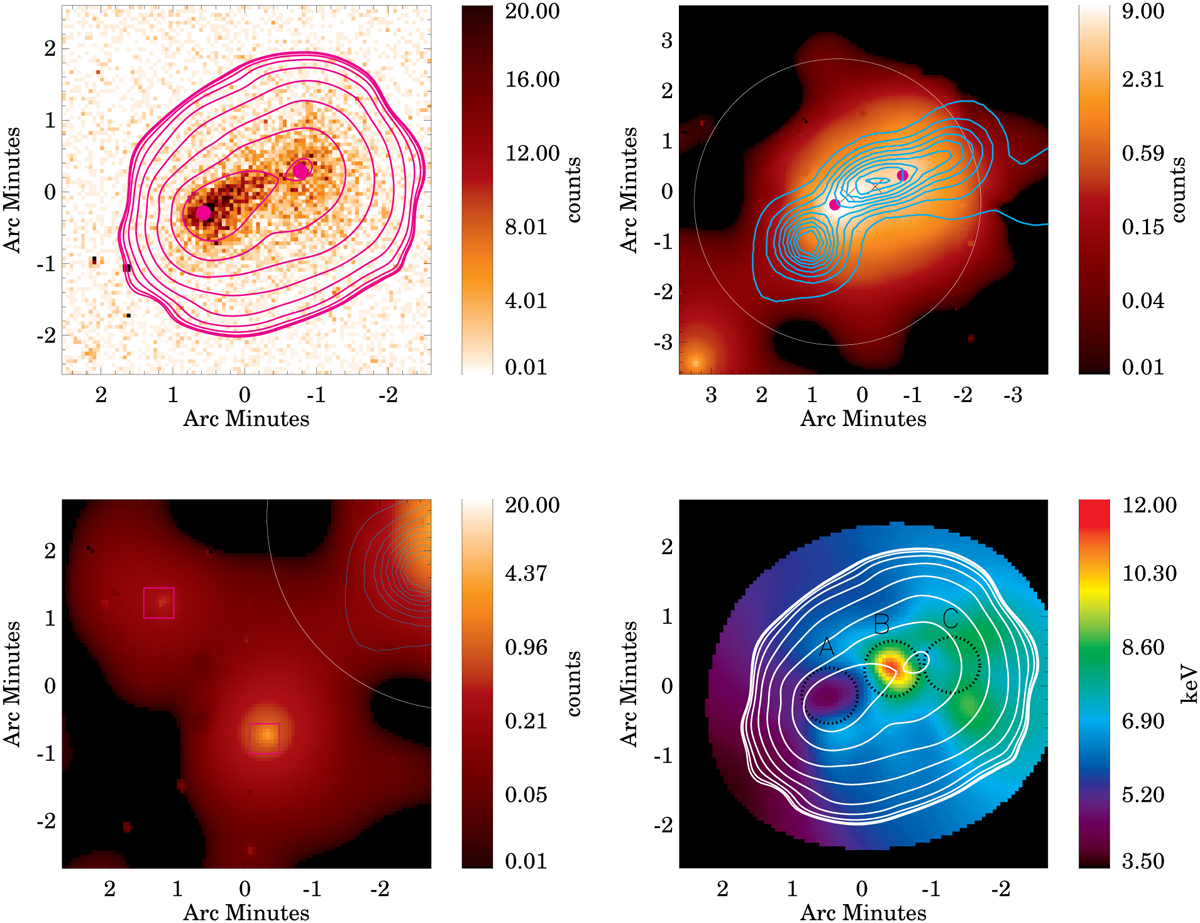
Spatially resolved morphological and thermodynamic analysis of PSZ2 G282.28+49.94. Top left panel: same as in Fig. 2, with the position of the X-ray peaks highlighted by the magenta points and the iso-contours derived from the wavelet-cleaned image in the top right panel. Top right panel: wavelet-cleaned image in the [0.5–2.5] keV band centred on the central part of the cluster. The white circle encompasses ![]() . The two crosses identify the position of BCG1 and BCG2 described in Sect. 3.2. The cyan contours identify the iso-levels of the spectroscopic galaxy members of PSZ2 G282.28+49.94. The map is in unit of counts. Bottom left panel: offset view of the extended emissions in the E sector highlighted by the magenta squares, as in Fig. 2. The E emission is interacting with the main cluster, being at the same redshift. The SE is associated with a foreground group emission at z ~ 0.17 (see Sect. 3.4 for more details). Bottom right panel: Temperature map of PSZ2 G282.28+49.94. The white lines identify the iso-contours derived from the wavelet-cleaned map shown in the top right panel. The dotted black circles identify the three regions within which we extracted the spectra to derive the spectroscopic temperature, whose co-ordinates and radius are reported in Table 2. The units of the colour bar are keV.
. The two crosses identify the position of BCG1 and BCG2 described in Sect. 3.2. The cyan contours identify the iso-levels of the spectroscopic galaxy members of PSZ2 G282.28+49.94. The map is in unit of counts. Bottom left panel: offset view of the extended emissions in the E sector highlighted by the magenta squares, as in Fig. 2. The E emission is interacting with the main cluster, being at the same redshift. The SE is associated with a foreground group emission at z ~ 0.17 (see Sect. 3.4 for more details). Bottom right panel: Temperature map of PSZ2 G282.28+49.94. The white lines identify the iso-contours derived from the wavelet-cleaned map shown in the top right panel. The dotted black circles identify the three regions within which we extracted the spectra to derive the spectroscopic temperature, whose co-ordinates and radius are reported in Table 2. The units of the colour bar are keV.
Current usage metrics show cumulative count of Article Views (full-text article views including HTML views, PDF and ePub downloads, according to the available data) and Abstracts Views on Vision4Press platform.
Data correspond to usage on the plateform after 2015. The current usage metrics is available 48-96 hours after online publication and is updated daily on week days.
Initial download of the metrics may take a while.