Fig. 8.
Download original image
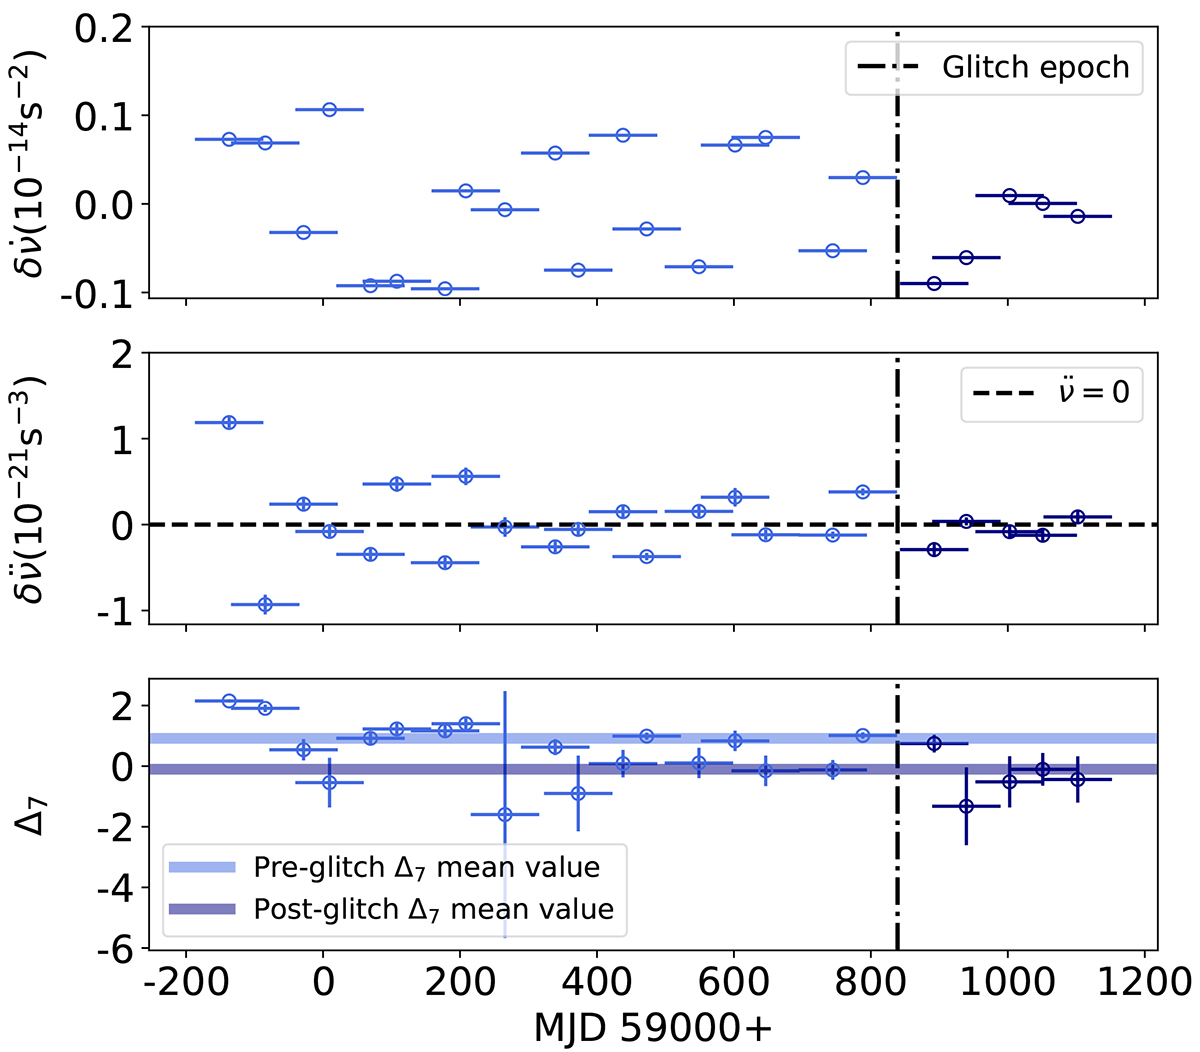
Timing parameters of J0742−2822 calculated in 100 d windows with consecutive windows overlapping by 50 TOAs; the time window is represented with a horizontal error bar. Top: Evolution of ![]() with the glitch model subtracted (Eq. 2). Centre: Evolution of
with the glitch model subtracted (Eq. 2). Centre: Evolution of ![]() with the glitch model subtracted. Bottom: Evolution of Δ7 calculated from ν and
with the glitch model subtracted. Bottom: Evolution of Δ7 calculated from ν and ![]() with the glitch model subtracted Sect. 5). The horizontal lines corresponds to the mean pre-glitch value of Δ7 and the mean post-glitch value of Δ7.
with the glitch model subtracted Sect. 5). The horizontal lines corresponds to the mean pre-glitch value of Δ7 and the mean post-glitch value of Δ7.
Current usage metrics show cumulative count of Article Views (full-text article views including HTML views, PDF and ePub downloads, according to the available data) and Abstracts Views on Vision4Press platform.
Data correspond to usage on the plateform after 2015. The current usage metrics is available 48-96 hours after online publication and is updated daily on week days.
Initial download of the metrics may take a while.