Fig. D.1
Download original image
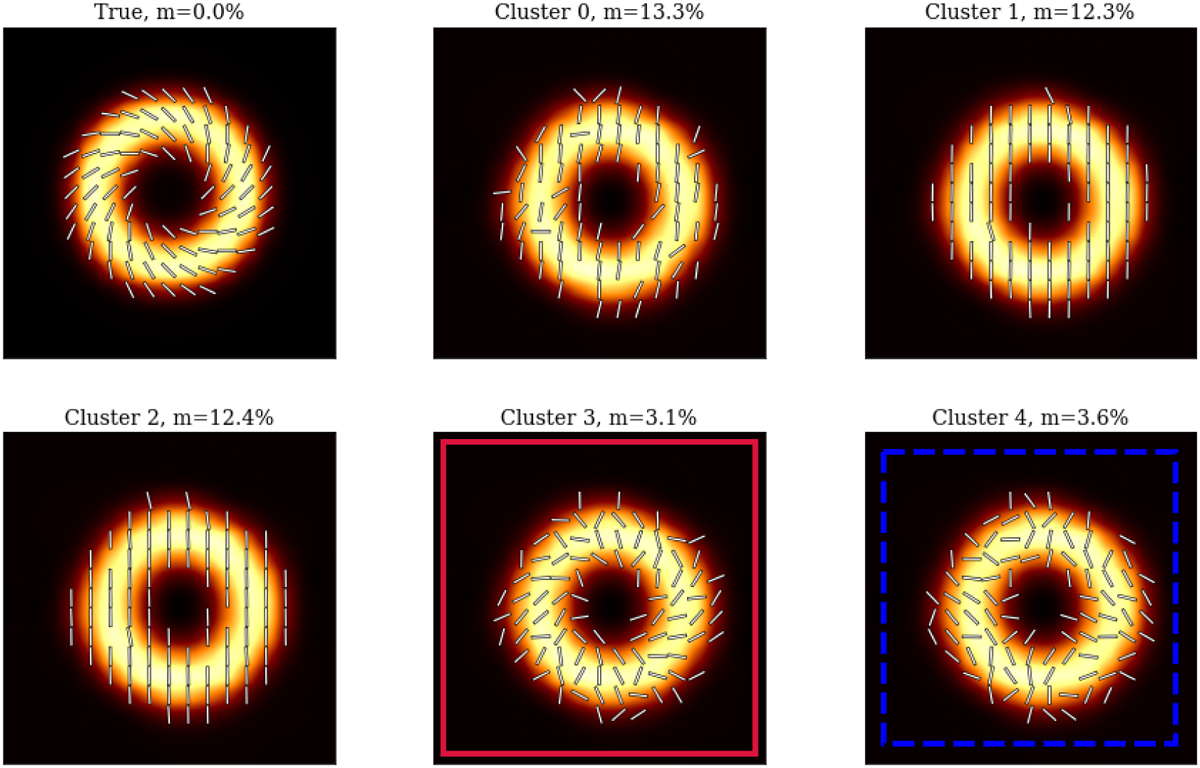
Pareto front of the MOEA/D reconstruction directly fitting to closure traces for the EHT+ngEHT array configuration. The solution in the red box is preferred by MOEA/D as the Pareto-optimal solution closest to the optimum; the cluster with the blue box would have been selected when comparing to closure quantities defined in Thyagarajan et al. (2022) and Samuel et al. (2022).
Current usage metrics show cumulative count of Article Views (full-text article views including HTML views, PDF and ePub downloads, according to the available data) and Abstracts Views on Vision4Press platform.
Data correspond to usage on the plateform after 2015. The current usage metrics is available 48-96 hours after online publication and is updated daily on week days.
Initial download of the metrics may take a while.