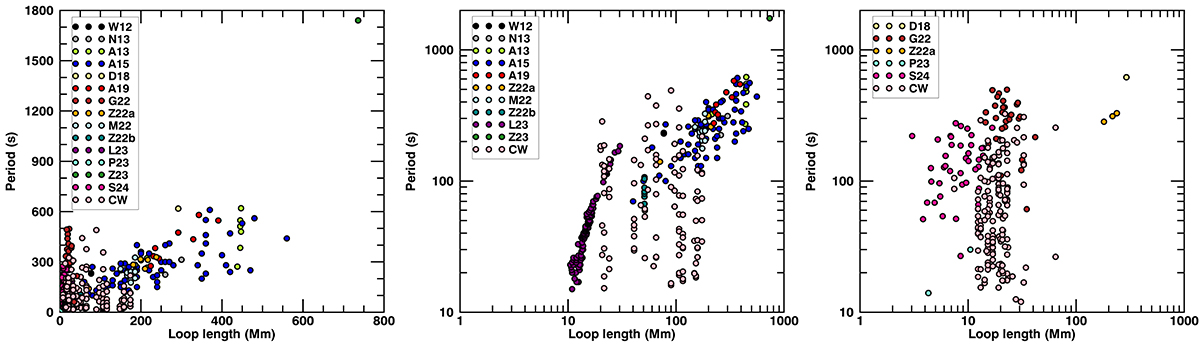
Fig. 4.
Download original image
Scatter plots between period and loop length of decayless oscillations analysed in the current work (CW) and previous studies (from top to bottom in the legend; Wang et al. 2012; Nisticò et al. 2013; Anfinogentov et al. 2013, 2015; Duckenfield et al. 2018; Anfinogentov & Nakariakov 2019; Gao et al. 2022; Zhong et al. 2022a, 2022b, 2023a; Mandal et al. 2022; Li & Long 2023; Petrova et al. 2023; Shrivastav et al. 2024). The scatter plots for ARs (middle panel) and QS (right panel) are presented in log scales.
Current usage metrics show cumulative count of Article Views (full-text article views including HTML views, PDF and ePub downloads, according to the available data) and Abstracts Views on Vision4Press platform.
Data correspond to usage on the plateform after 2015. The current usage metrics is available 48-96 hours after online publication and is updated daily on week days.
Initial download of the metrics may take a while.