Fig. 9.
Download original image
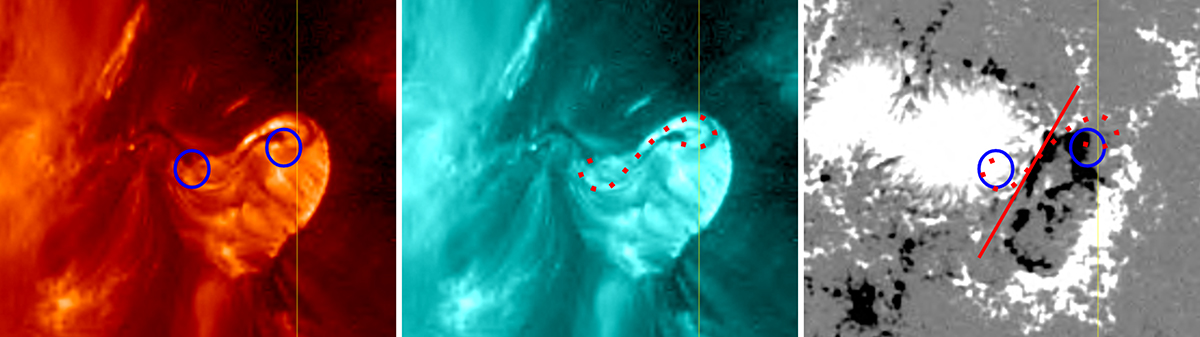
Images taken from JHelioviewer corresponding to the source of the CME related to the eruption at 09:22:11 on February 16, 2014. The left panel shows the image of the solar atmosphere in SDO/AIA 304 Å wavelength, where the circles identify the footpoints. The middle panel shows the solar corona in SDO/AIA 131 Å wavelength, with a dotted sigmoid shape plotted on top. The right panel shows the HMI magnetogram with the red line corresponding to the PIL together with the dotted sigmoid and the footprints plotted on the left and middle panels.
Current usage metrics show cumulative count of Article Views (full-text article views including HTML views, PDF and ePub downloads, according to the available data) and Abstracts Views on Vision4Press platform.
Data correspond to usage on the plateform after 2015. The current usage metrics is available 48-96 hours after online publication and is updated daily on week days.
Initial download of the metrics may take a while.